Loading…
Enterprise AI Adoption Strategy Analysis
11 min read
215
Research Background
In today’s digital era, enterprises face a strategic crossroads in adopting AI. Some organizations embrace AI aggressively, focusing on automation and innovation; others take a cautious stance, prioritizing compliance and risk control. Behind these opposing adoption strategies lies a deep organizational question: what factors drive firms to make such choices, and how do different strategies affect enterprise value and risk exposure?
This paper attempts to answer these questions from multiple theoretical perspectives.
Core Research Questions
My research focuses on the following key questions:
-
What are Pro-AI and AI-Restrictive organizations?
- Pro-AI organizations: proactive adoption, rapid innovation, high tolerance for failure
- AI-Restrictive organizations: conservative and cautious, emphasizing compliance and strict risk management
-
What factors influence enterprise AI adoption strategy?
- Technological factors (infrastructure readiness, technical debt)
- Organizational factors (risk culture, governance structures)
- Environmental factors (institutional pressure, industry competition)
-
How do different strategies affect value creation and risk?
- Business value: efficiency, innovation, competitive advantage
- Risk exposure: compliance, data privacy, technological dependency
Theoretical Framework
Figure 2.1: Integrated Theoretical Framework
I draw on multiple theoretical lenses to build the analytical framework:
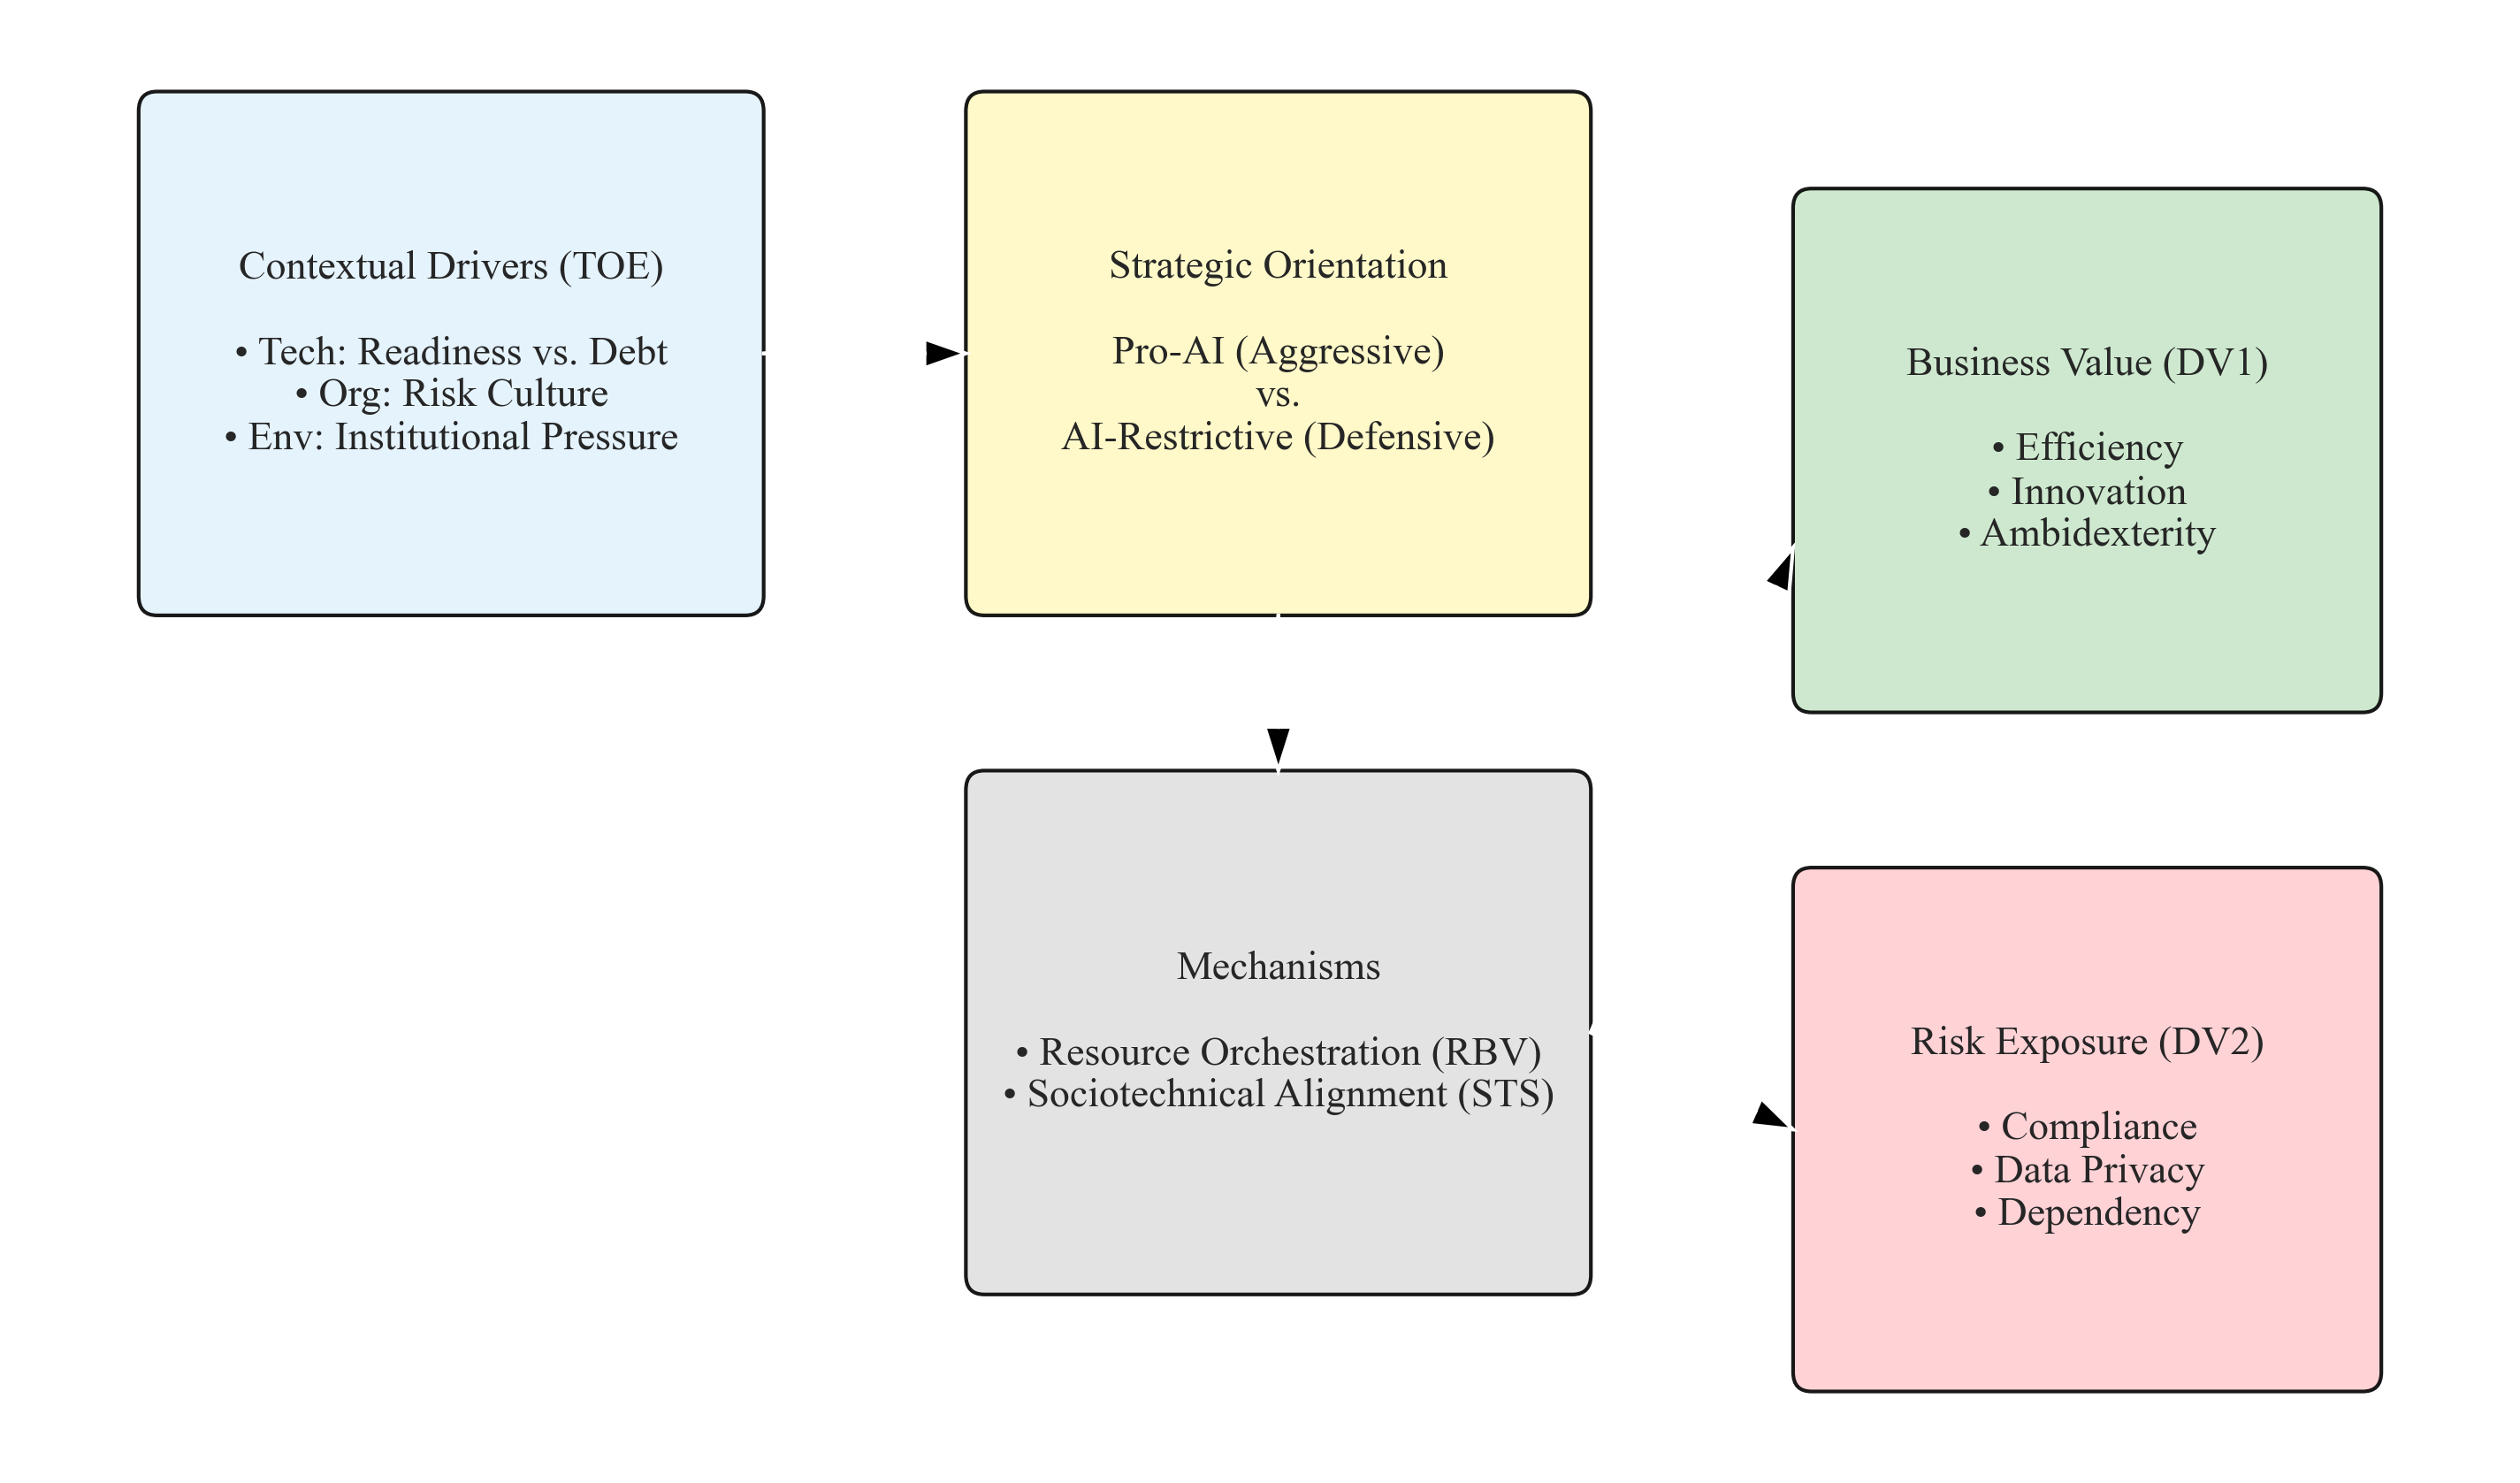
Framework explanation:
Contextual Drivers are grounded in the TOE framework:
- Technology: enterprise infrastructure readiness and technical debt
- Organization: organizational risk culture and decision styles
- Environment: institutional pressure from regulators, competitors, and customers
These factors jointly determine whether an enterprise adopts a Pro-AI (aggressive) or AI-Restrictive (defensive) strategic orientation.
Mechanisms include:
- Resource orchestration (RBV perspective): how human, technical, and financial resources are coordinated
- Sociotechnical alignment (STS perspective): the fit between people’s capabilities and system design
These mechanisms explain why some organizations benefit from AI investment while others struggle.
Outcomes manifest in two dimensions:
- Business value: efficiency, innovation, organizational ambidexterity
- Risk exposure: compliance risk, data privacy risk, dependency risk
Figure 2.2: Implementation Cost Curve (The J-Curve)
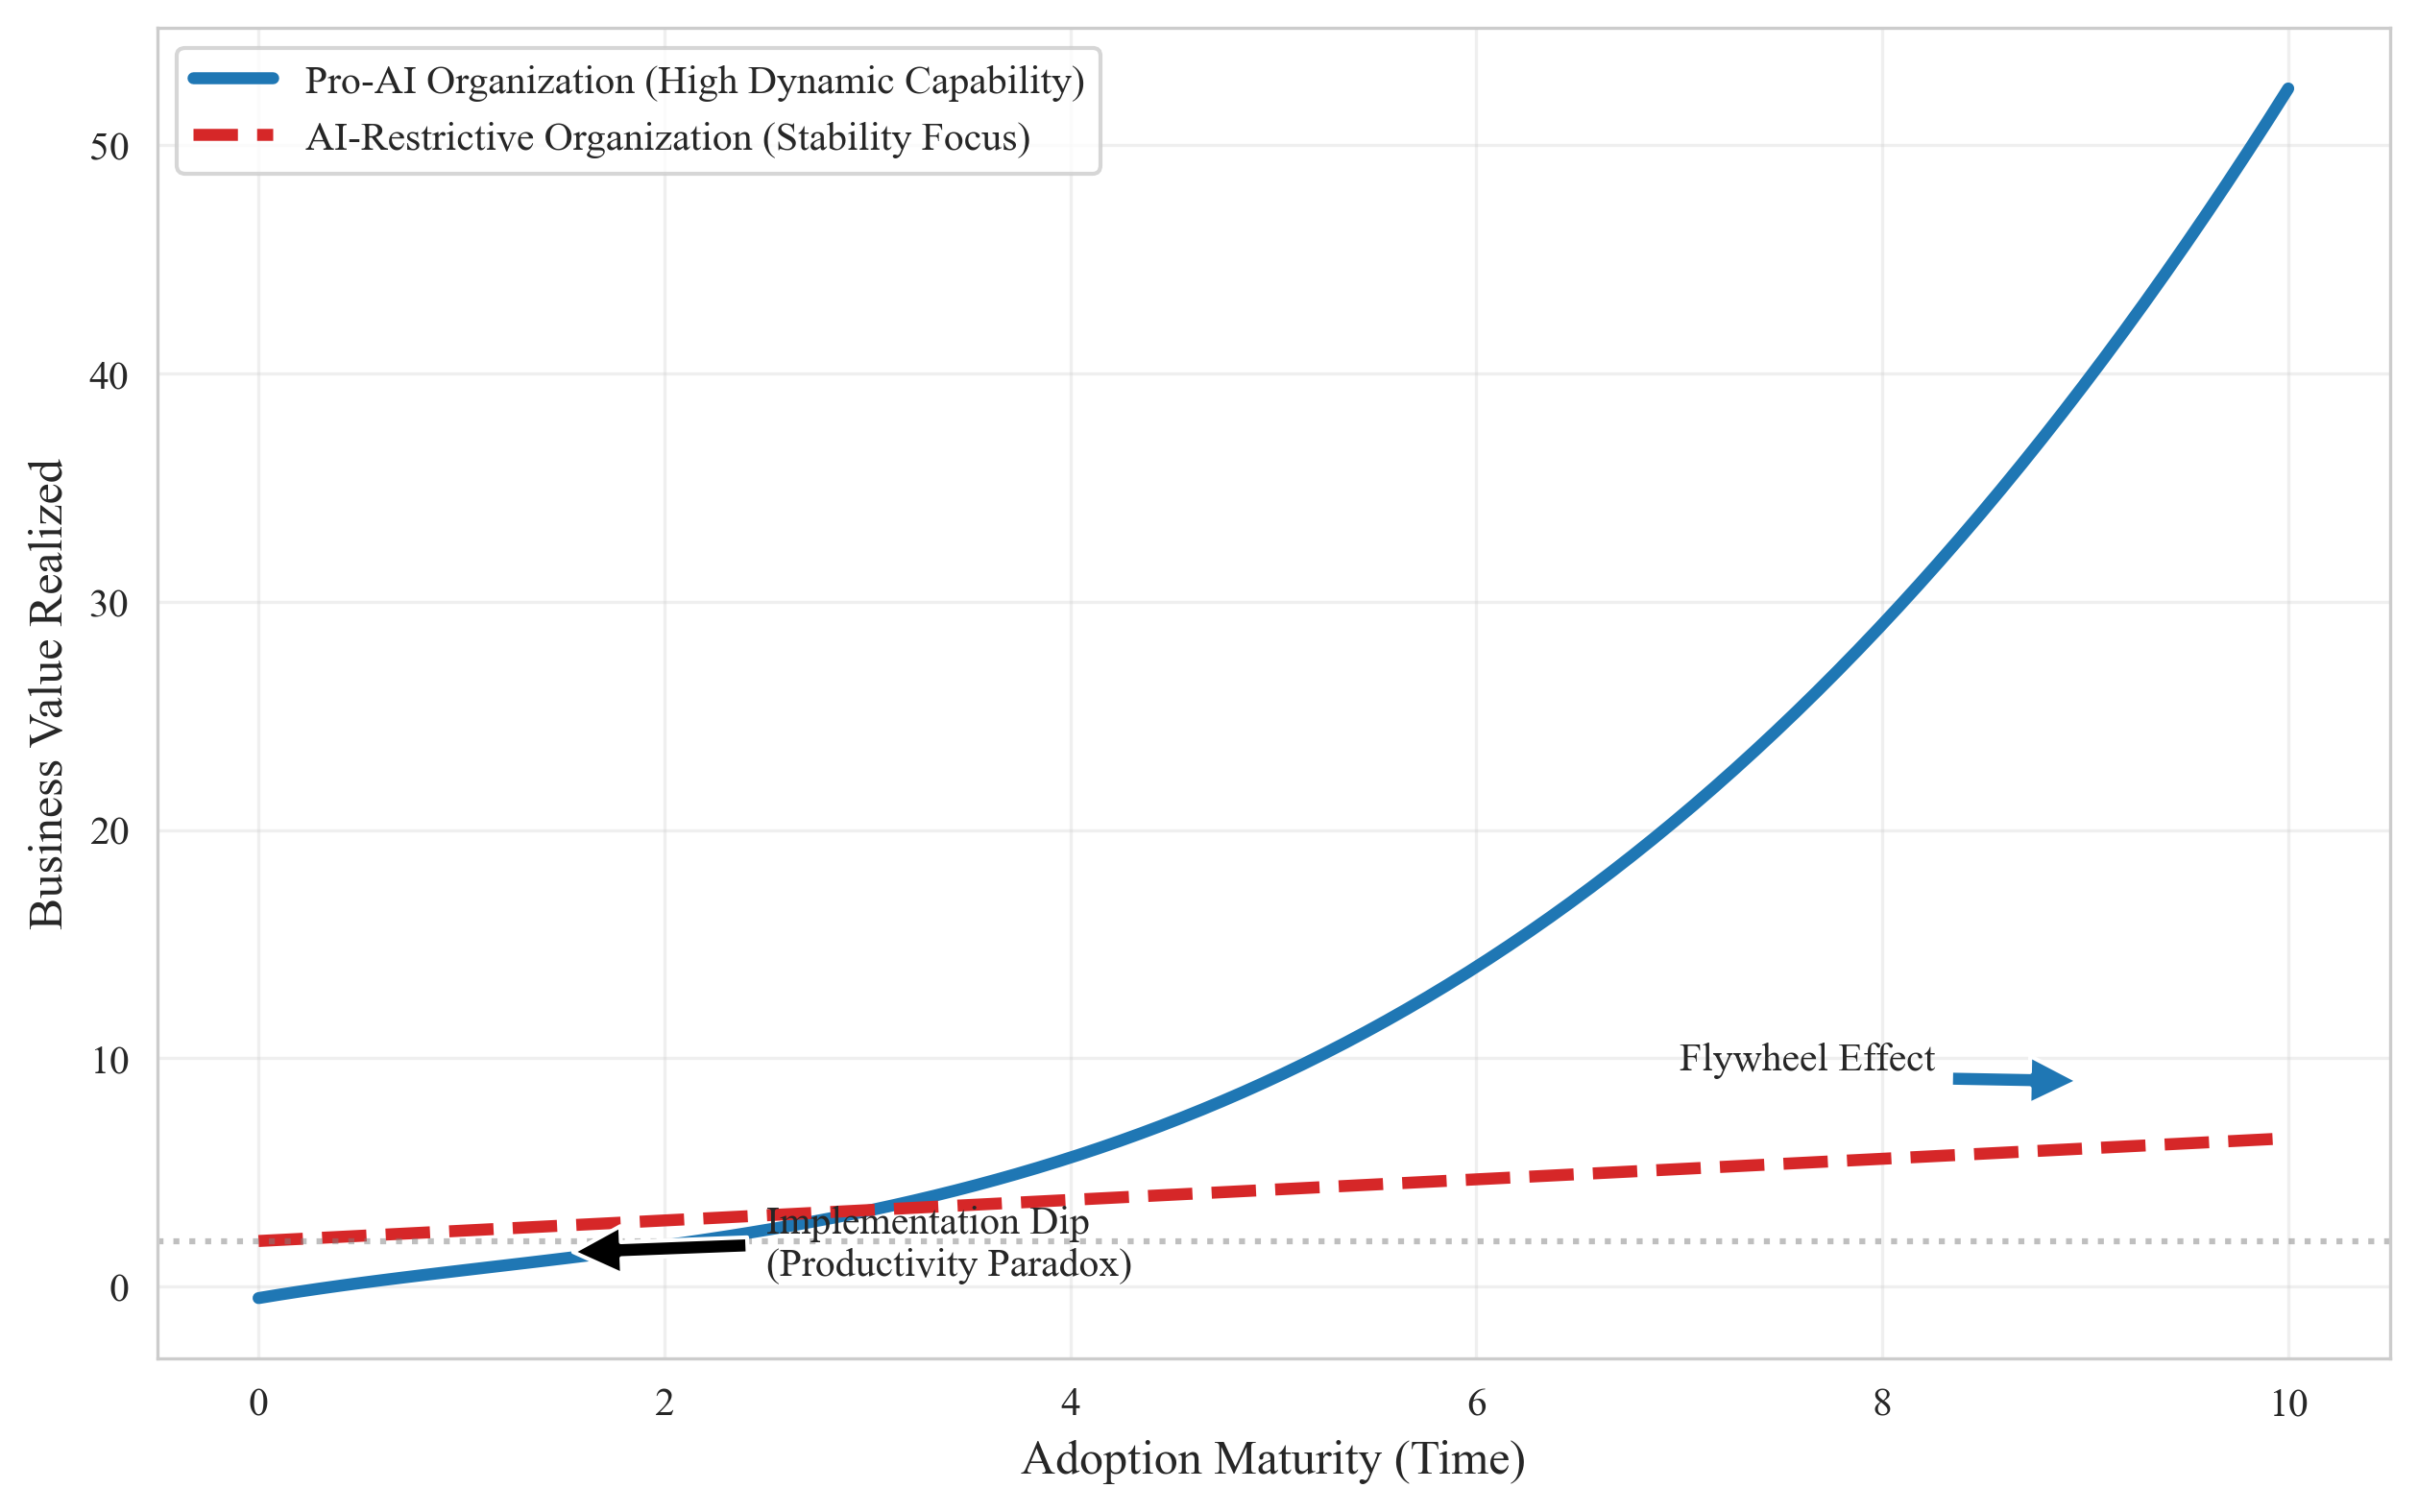
This curve reflects a key phenomenon — the productivity paradox.
Key observations:
The early “value trap”: both Pro-AI and AI-Restrictive organizations experience an initial productivity decline during AI deployment because:
- employees must learn new tools and processes
- system integration and debugging take time
- organizational workflows need redesign
The divergence lies in the recovery trajectory:
- Pro-AI organizations (blue line): after initial adjustment, stronger dynamic capabilities and faster learning lead to a flywheel effect and significant long-term value creation
- AI-Restrictive organizations (red line): a steadier and more cautious approach avoids large swings, but long-term growth is constrained
This suggests: being aggressive doesn’t guarantee maximum returns, and being conservative doesn’t guarantee survival. The key is managing implementation risk.
Figure 2.3: Risk Distribution Model
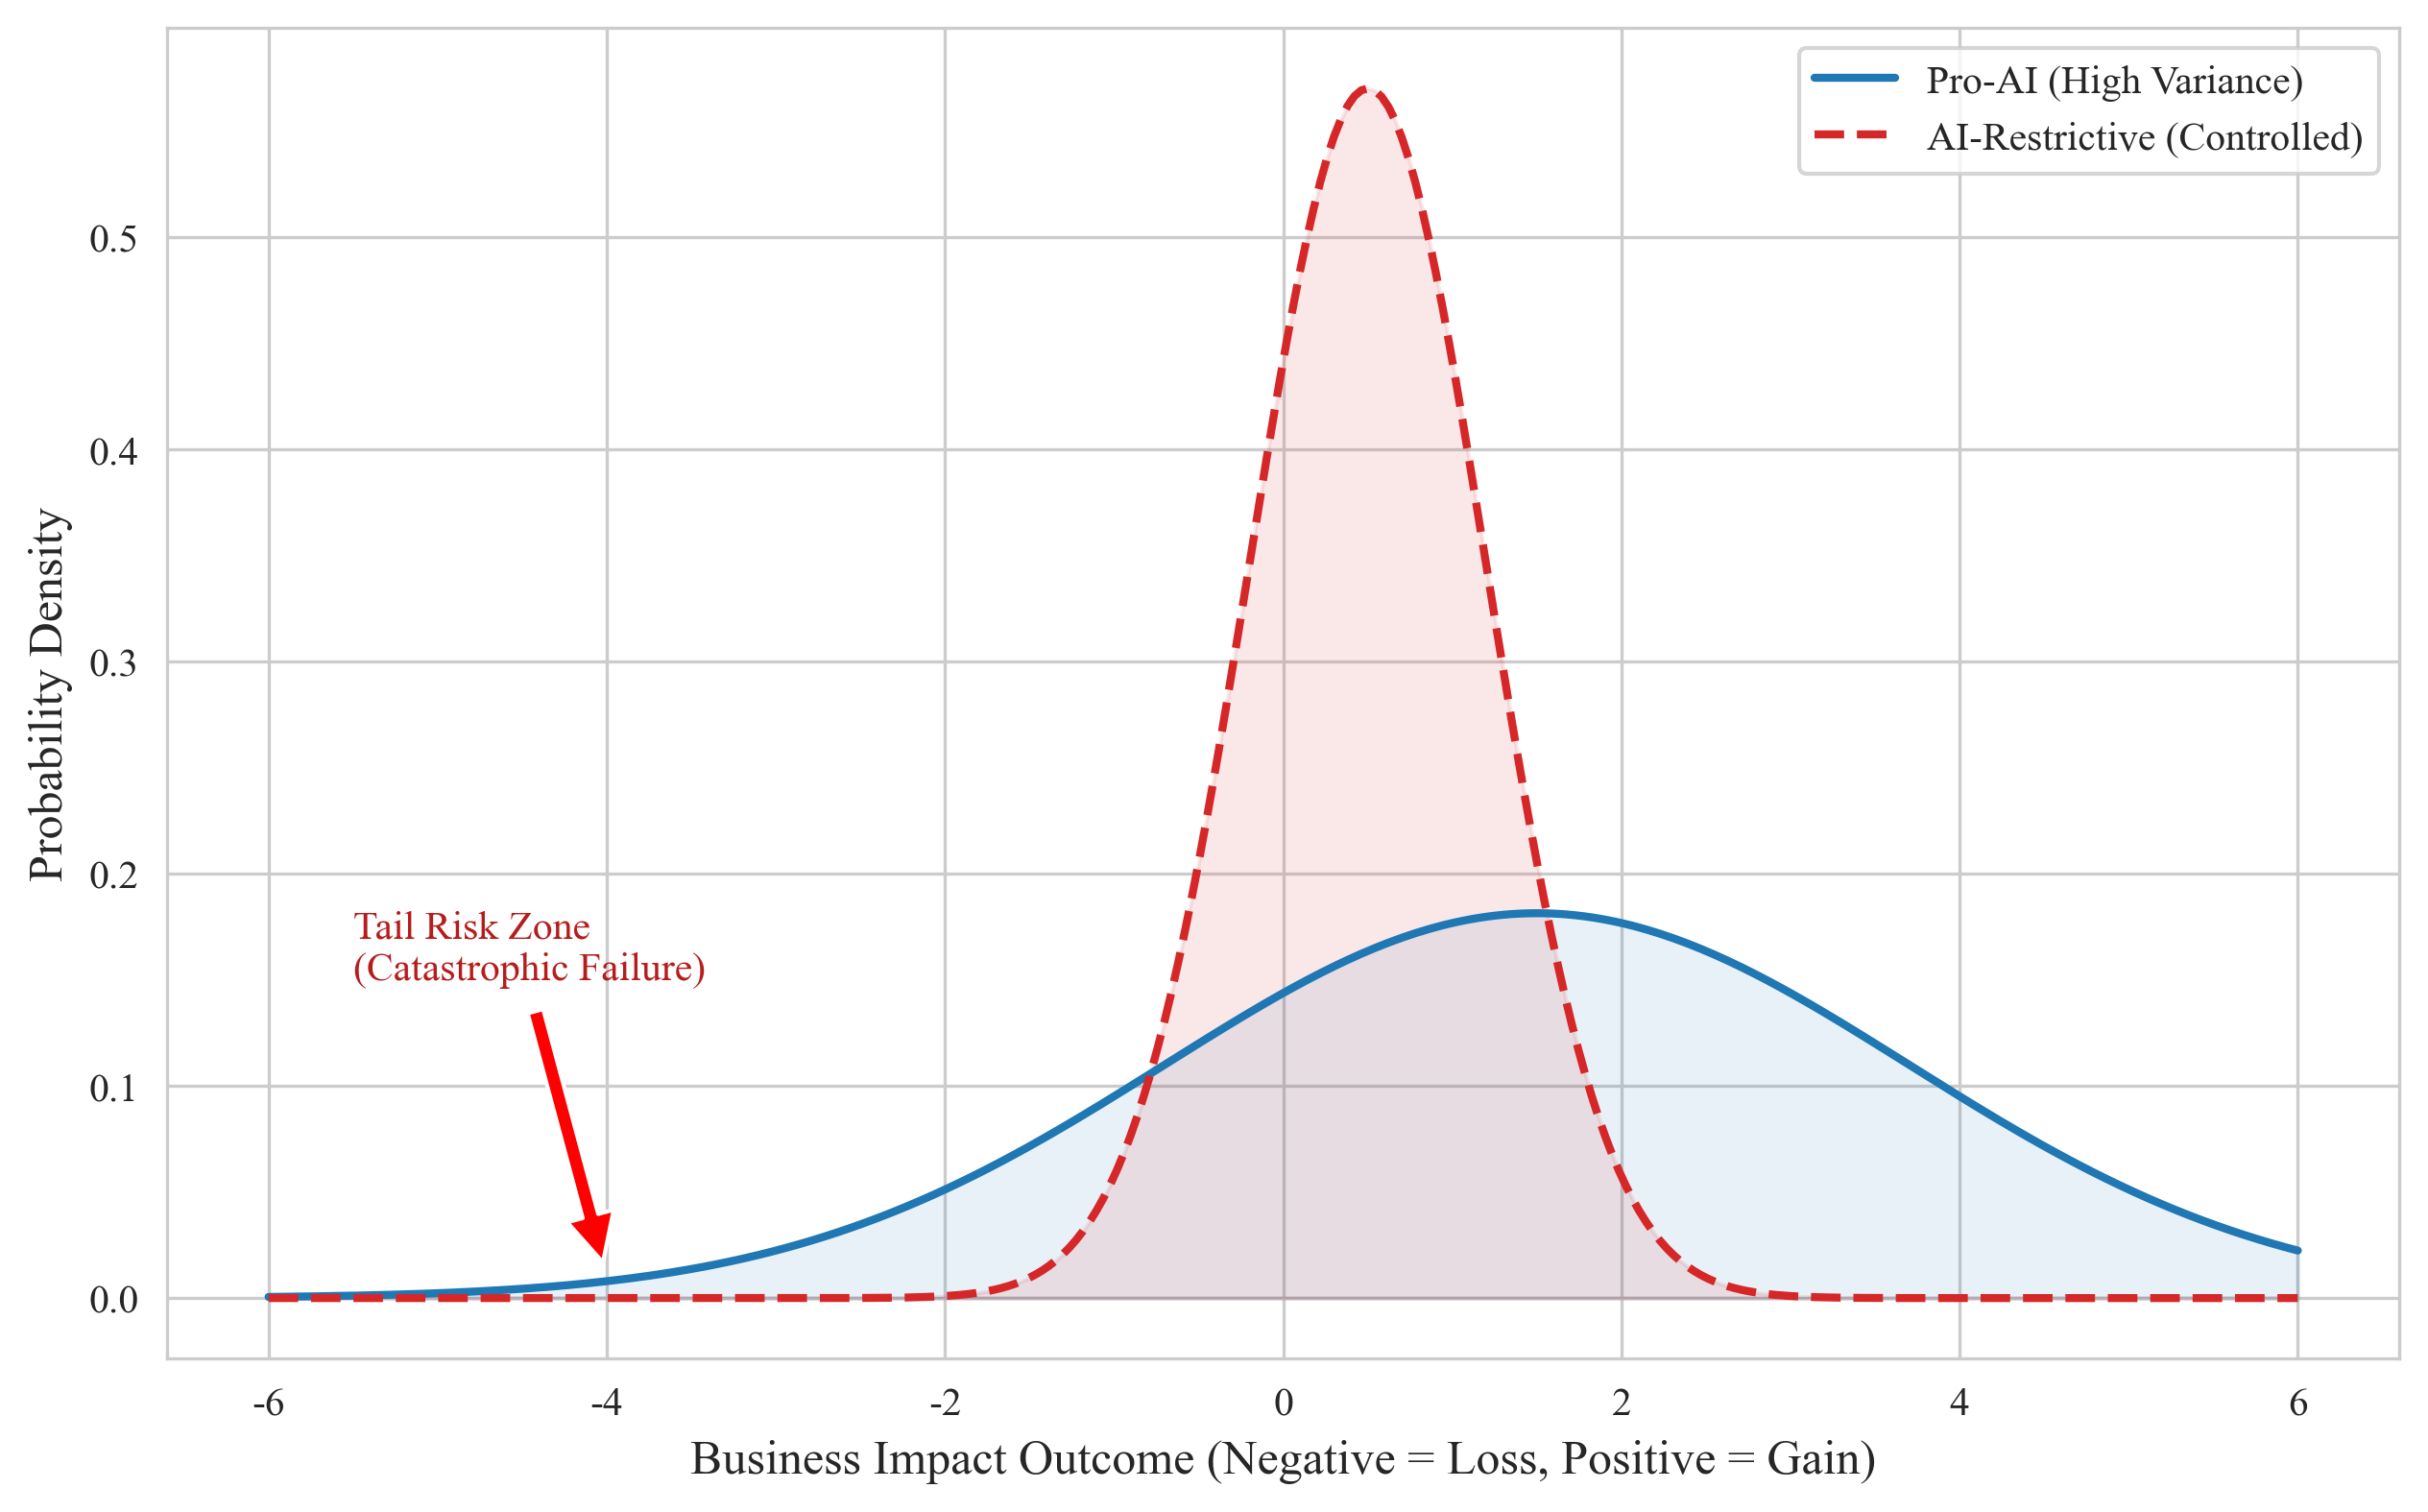
This model borrows from finance: it uses probability distributions to characterize strategic risk profiles.
Distribution comparison:
Pro-AI organizations (blue line):
- wider distribution (higher variance)
- higher upside potential (right tail) but also catastrophic failure risk (left tail)
- reflects the dual nature of aggressive innovation: breakthrough vs. landmine
AI-Restrictive organizations (red line):
- narrower distribution (lower variance)
- outcomes clustered around moderate results
- risks are more controlled, but upside potential is limited
Tail risk matters:
- the red-box region indicates “catastrophic failure” — low probability but severe consequences (e.g., data breach, regulatory penalties)
- Pro-AI organizations require stronger risk management to control left-tail risk
Figure 2.4: Governance Matrix
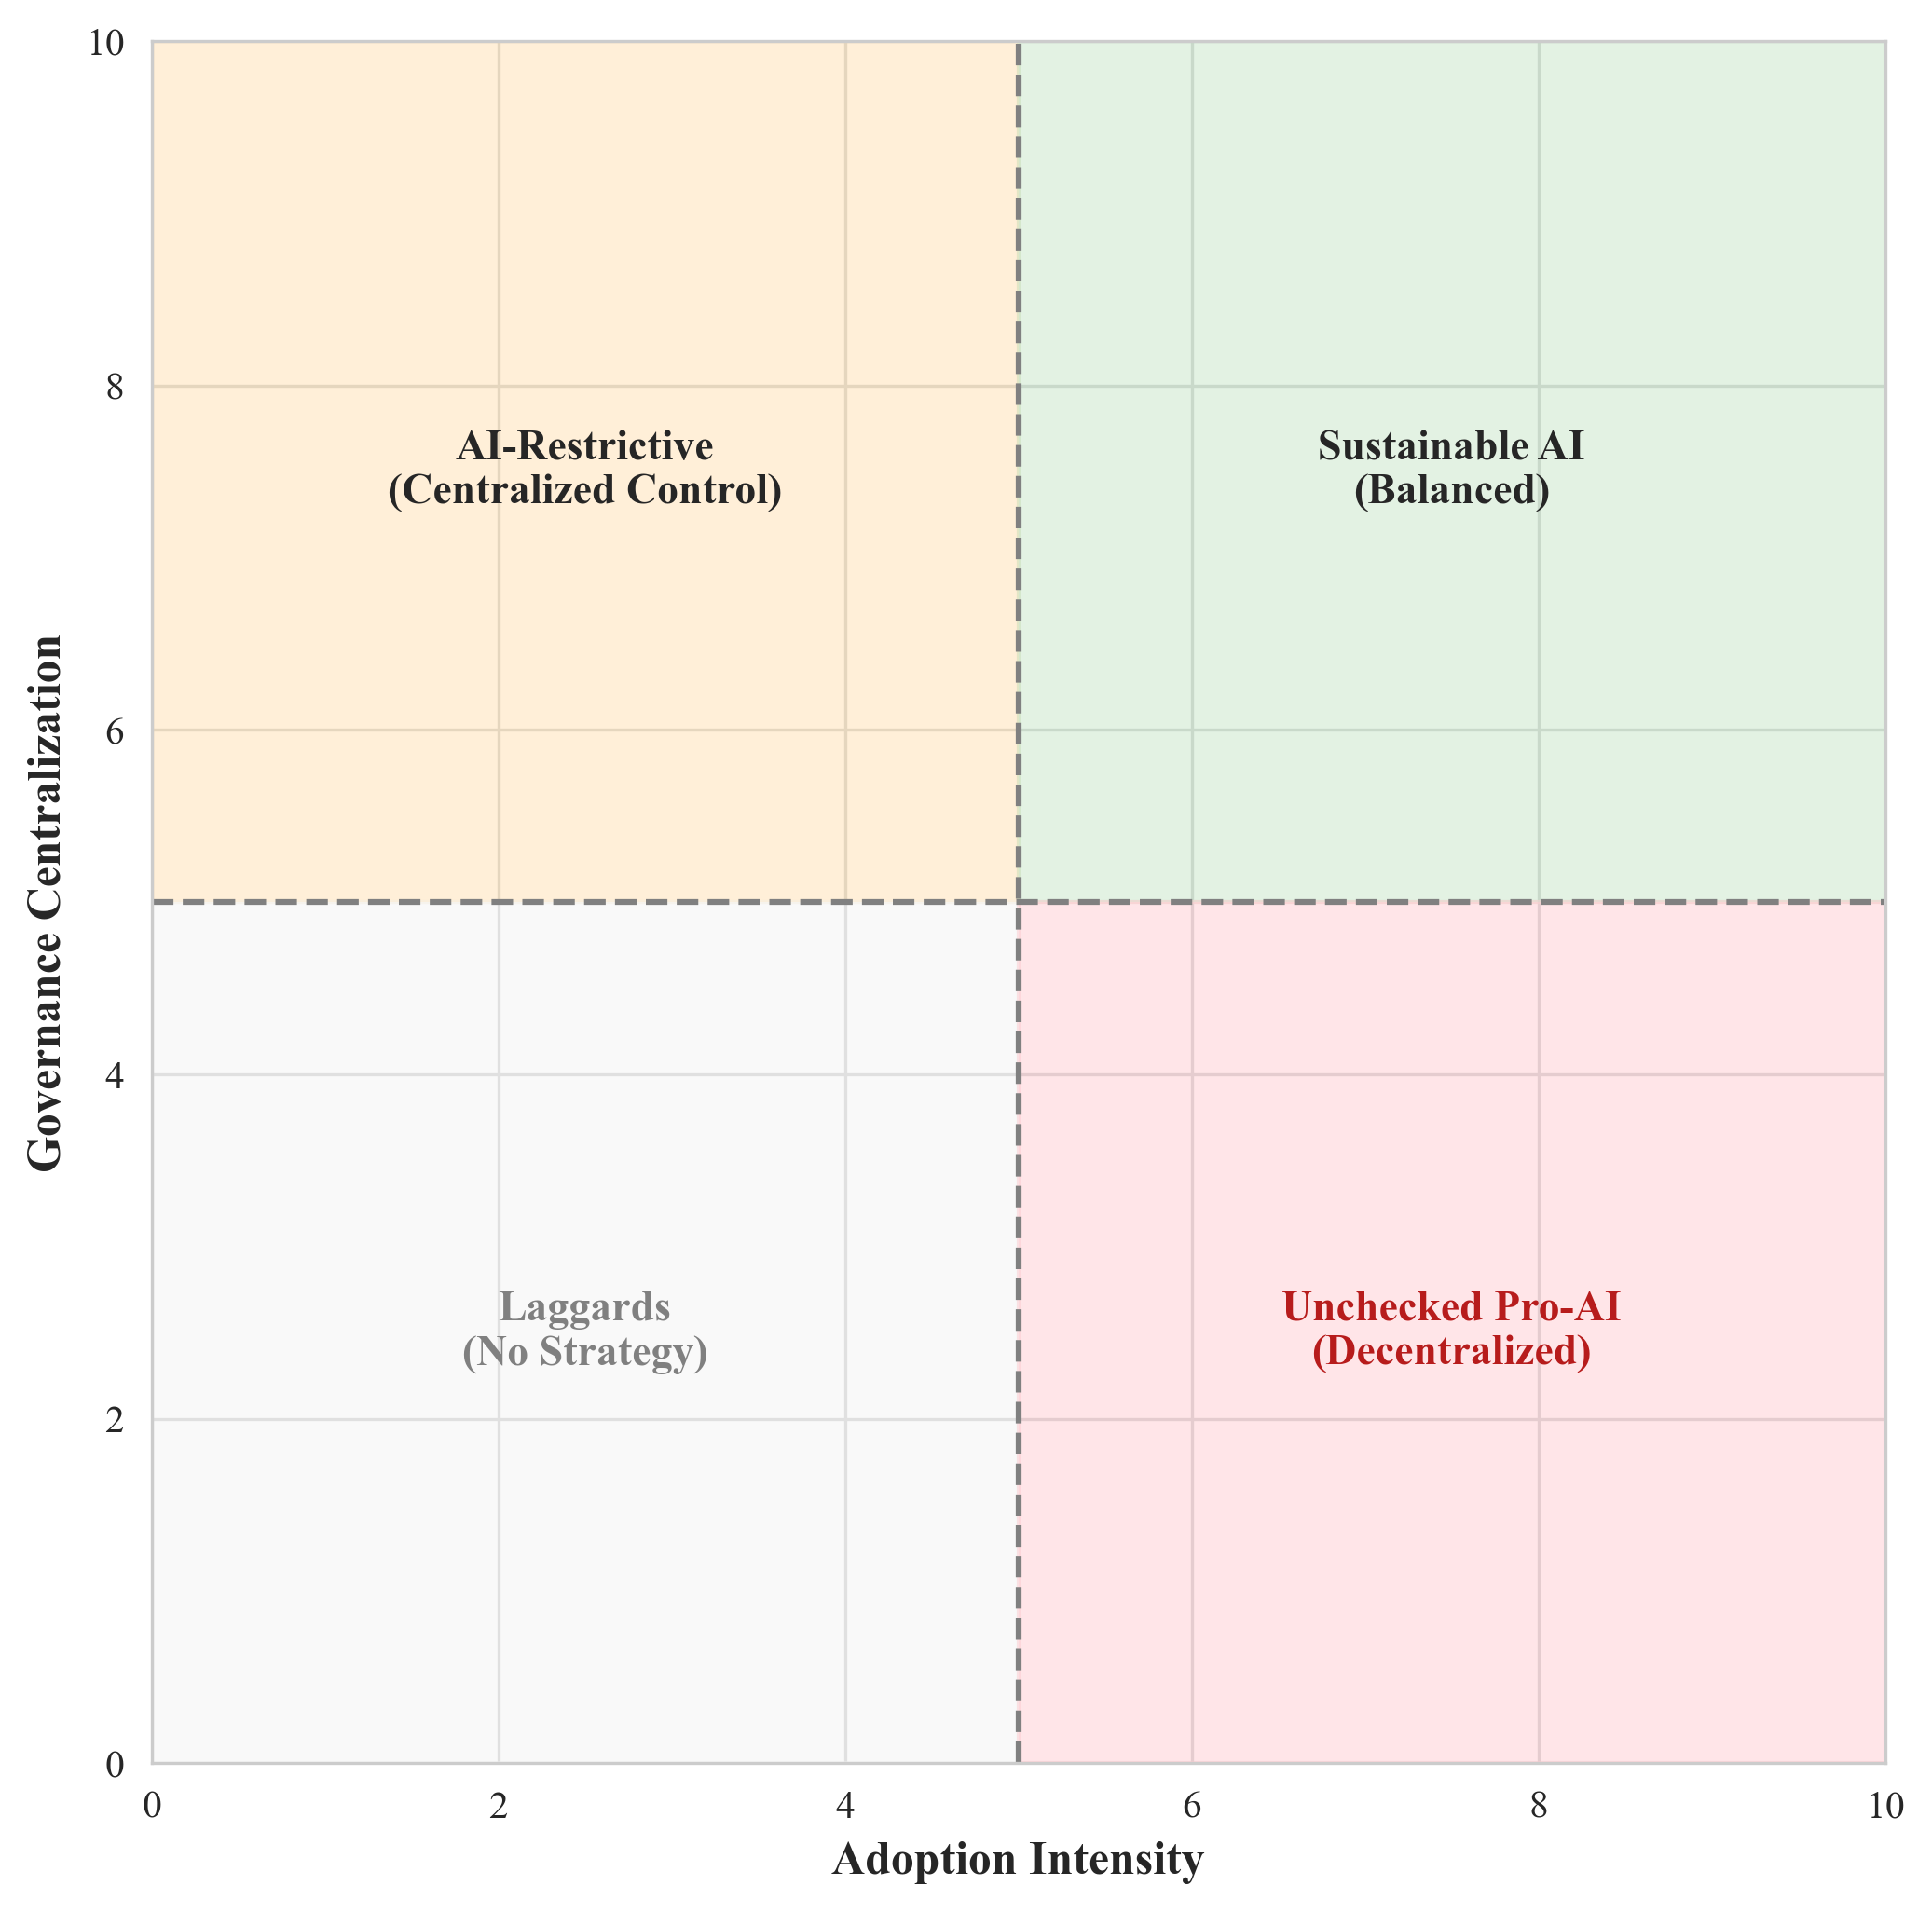
This 2×2 matrix reflects two critical dimensions:
- X-axis: AI adoption intensity (from low to high)
- Y-axis: governance centralization (from decentralized to centralized)
Strategic combinations by quadrant:
| Quadrant | Characteristics | Evaluation |
|---|---|---|
| Top-left - AI-Restrictive (Centralized Control) | low adoption, centralized governance | safe but innovation constrained |
| Top-right - Sustainable AI (Balanced) | high adoption, moderately centralized governance | ideal state ✓ |
| Bottom-left - Laggards (No Strategy) | low adoption, decentralized governance | risky; directionless |
| Bottom-right - Unchecked Pro-AI (Decentralized) | high adoption, decentralized governance | high risk; potential chaos |
Optimal path: the top-right quadrant (Sustainable AI) — fully leveraging AI opportunities while managing risk through appropriate governance.
Theoretical Lenses
To systematically analyze AI adoption strategy, I draw on multiple disciplines:
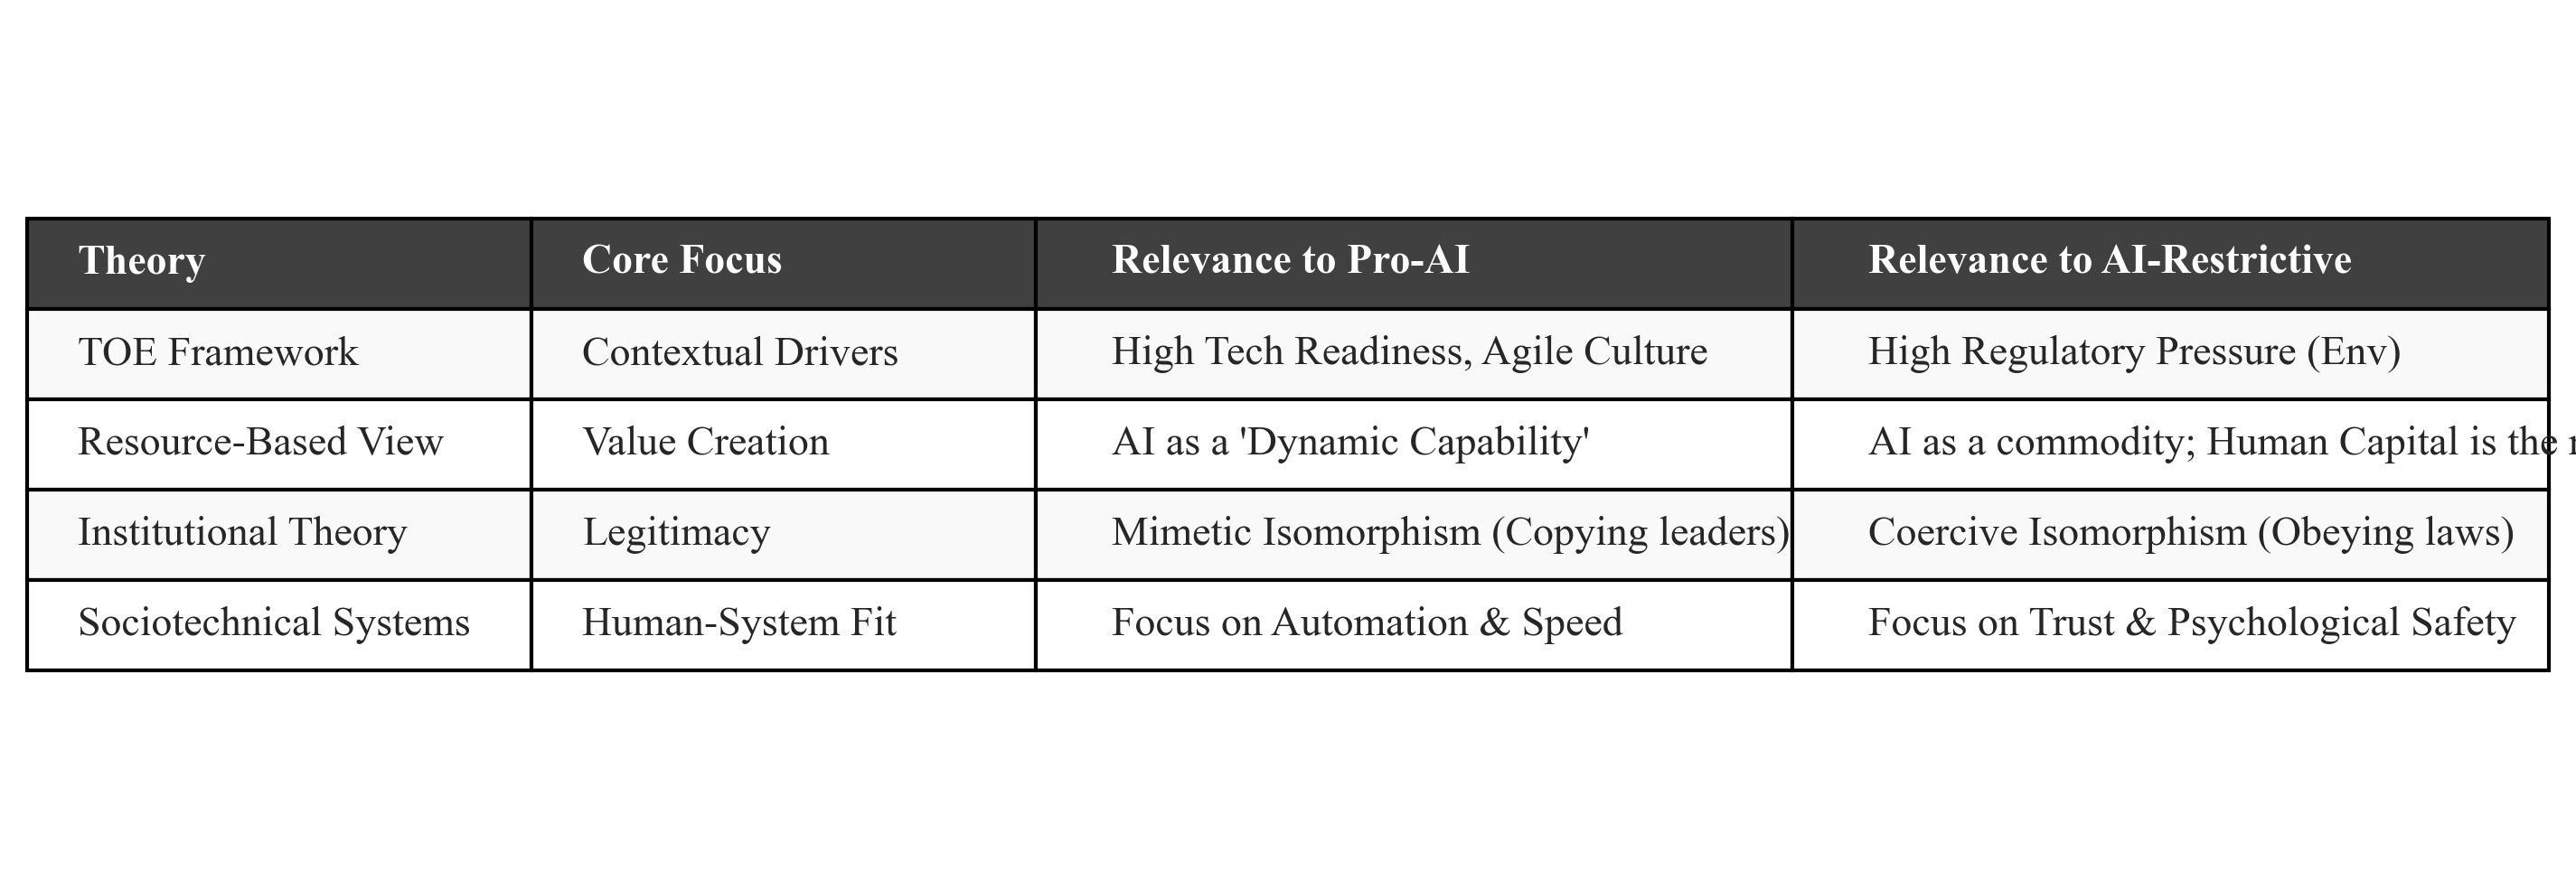
Contributions of each theory:
-
TOE Framework (Technology-Organization-Environment)
- explains why firms in different contexts make different choices
- higher tech readiness increases likelihood of Pro-AI strategy
- coercive institutional pressure (e.g., data protection laws) pushes AI-Restrictive choices
-
Resource-Based View (RBV)
- positions AI as a dynamic capability
- explains why some firms benefit more from AI investment
- emphasizes talent, IP, and organizational processes
-
Institutional Theory
- explains mimicry: firms imitate industry leaders (mimetic isomorphism)
- explains compliance: firms follow rules and norms (coercive isomorphism)
- focuses on legitimacy and social acceptance
-
Sociotechnical Systems (STS)
- stresses mutual adaptation between humans and technology
- Pro-AI organizations must change ways of working and mindsets
- AI-Restrictive organizations advance gradually based on trust
Pro-AI vs AI-Restrictive: Comparative Analysis
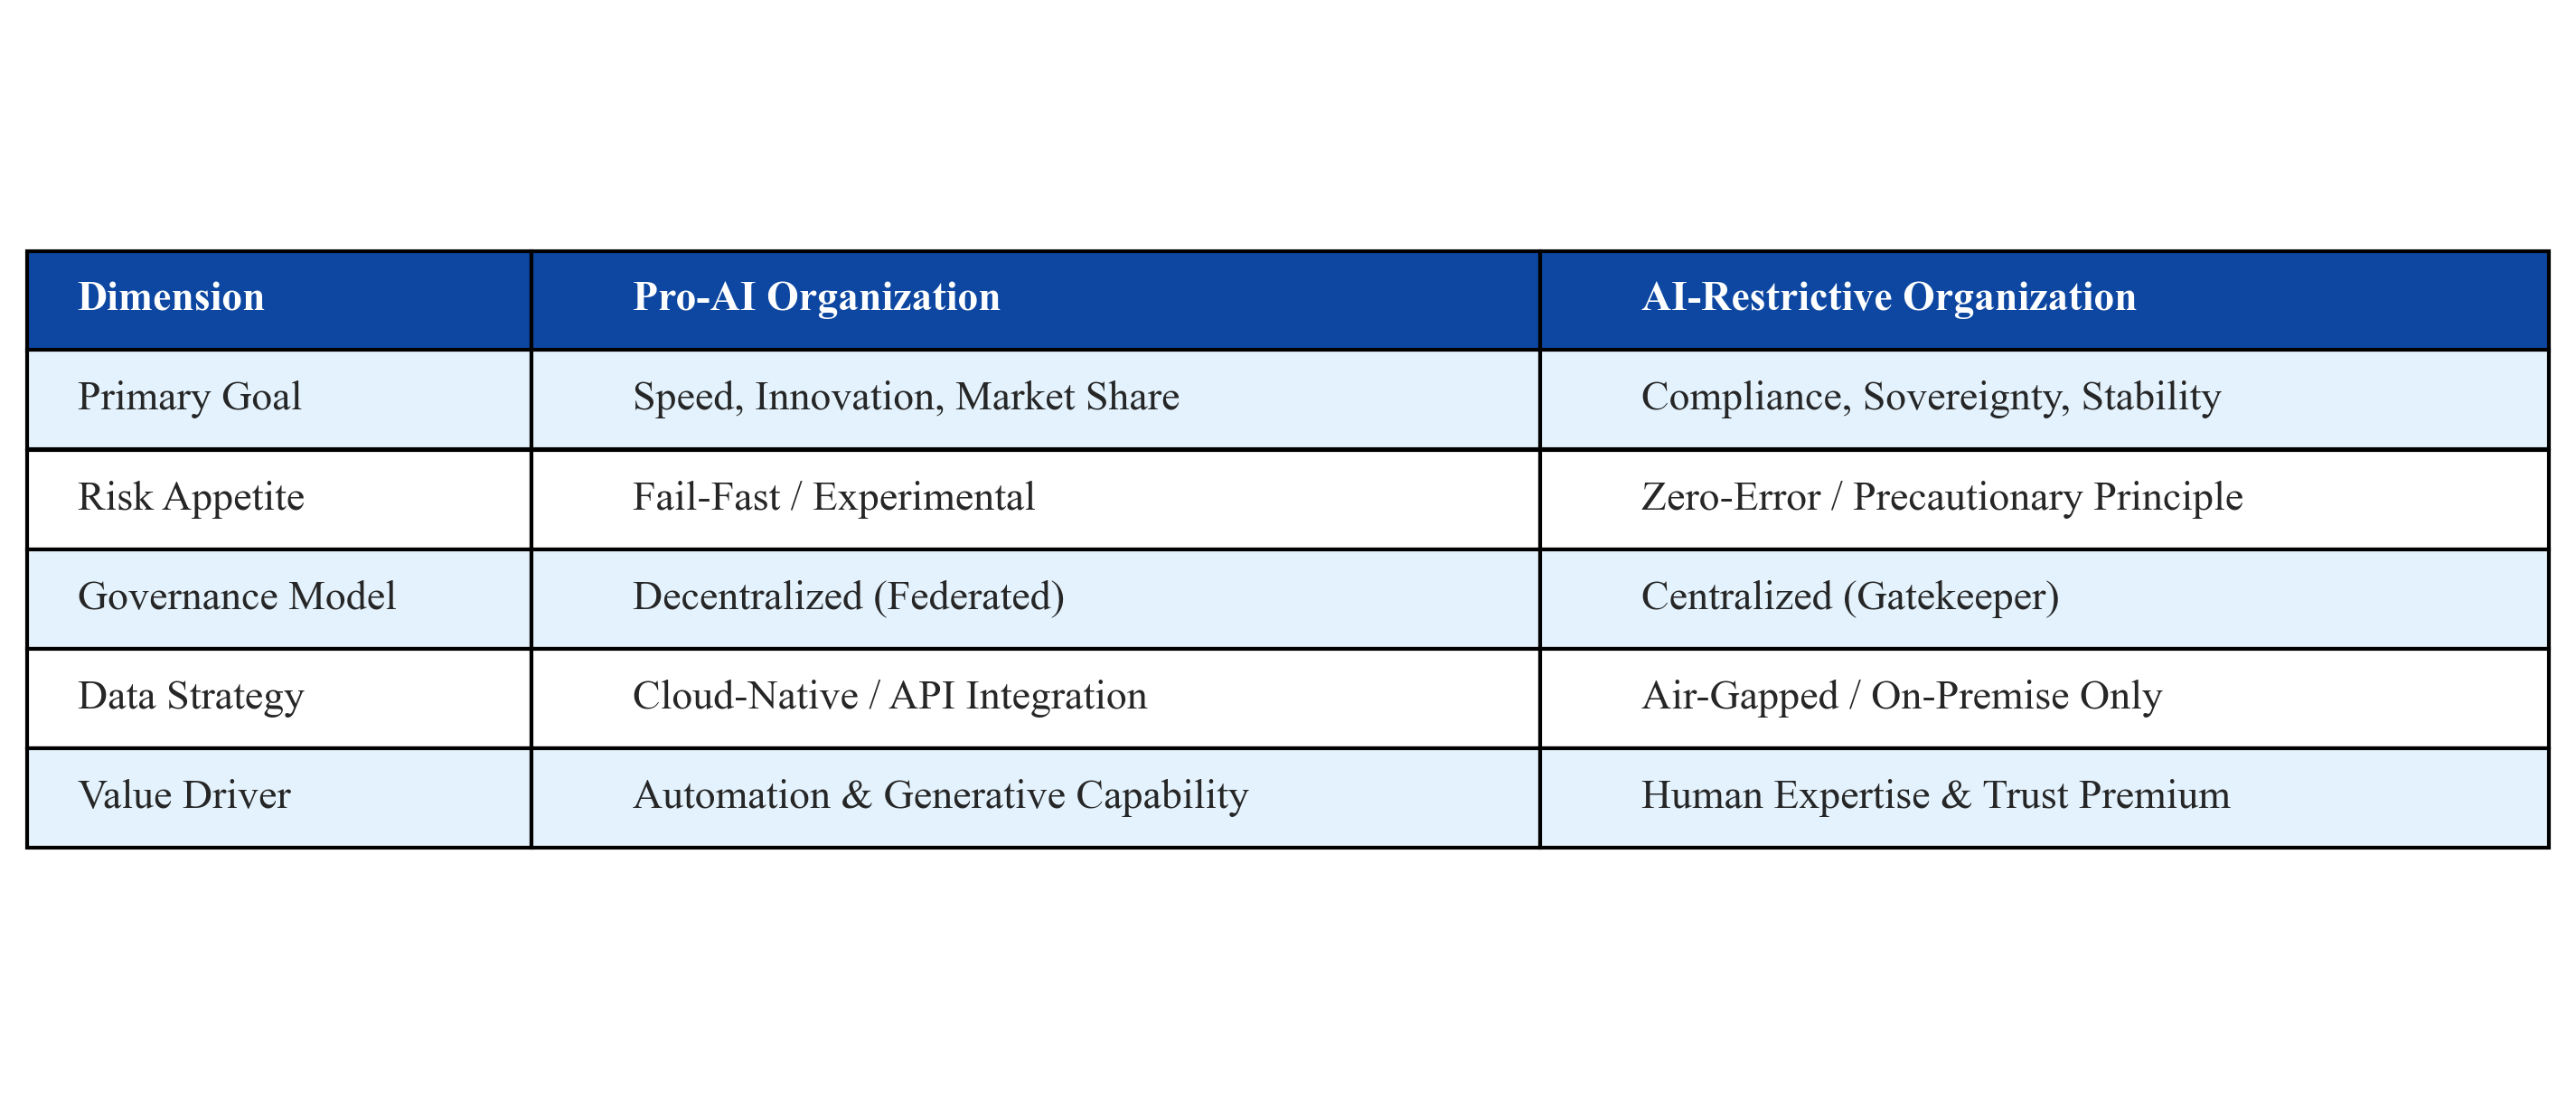
This matrix summarizes differences across multiple dimensions:
| Dimension | Pro-AI Organization | AI-Restrictive Organization |
|---|---|---|
| Primary Goal | speed, innovation, market share | compliance, sovereignty, stability |
| Risk Appetite | fail-fast, experimental | zero-error, precautionary principle |
| Governance Model | decentralized (federated) | centralized (gatekeeper) |
| Data Strategy | cloud-native, API integration | on-premise, air-gapped |
| Value Driver | automation, generative capability | human expertise, trust premium |
Practical implications:
- No absolute winner: both strategies fit different contexts
- Dynamic adjustment: firms may shift between the two as environments change
- Hybrid strategy: large enterprises may adopt different strategies across business units
- Balance is key: seize opportunities while managing risks
Data Visualization Code
To ensure reproducibility, I include the full Python code. You can run it to generate all charts and tables.
Requirements
pip install matplotlib numpy seaborn scipy pandasFull Code
import matplotlib.pyplot as plt
import numpy as np
import matplotlib.patches as patches
import seaborn as sns
from scipy.stats import norm
import pandas as pd
import os

# ======================== Configuration ========================
plt.style.use('default')
sns.set_style("whitegrid")
plt.rcParams['font.family'] = 'serif'
plt.rcParams['font.serif'] = ['Times New Roman'] + plt.rcParams['font.serif']
plt.rcParams['axes.unicode_minus'] = False

save_dir = 'Chapter2_Final_Assets'
if not os.path.exists(save_dir):
    os.makedirs(save_dir)

def save_plot(filename):
    """Save plot to the output directory"""
    path = os.path.join(save_dir, filename)
    plt.savefig(path, dpi=300, bbox_inches='tight')
    plt.close()
    print(f"✓ Saved: {path}")

# ======================== Figure 2.1: Theoretical Framework ========================
def plot_figure_2_1_clean():
    """Render integrated theoretical framework"""
    fig, ax = plt.subplots(figsize=(12, 7))
    ax.axis('off')

    def draw_box(x, y, w, h, text, color):
        """Helper: draw rounded rectangle"""
        rect = patches.FancyBboxPatch((x, y), w, h, boxstyle="round,pad=0.1",
                                     fc=color, ec="black", alpha=0.9)
        ax.add_patch(rect)
        ax.text(x + w/2, y + h/2, text, ha='center', va='center',
               fontsize=11, wrap=True)

    # Layer 1: contextual drivers
    draw_box(0.5, 5, 3.2, 2.5,
            "Contextual Drivers (TOE)\n\n• Tech: Readiness vs. Debt\n• Org: Risk Culture\n• Env: Institutional Pressure",
            "#e3f2fd")

    # Layer 2: strategic orientation
    draw_box(5.0, 5, 3.2, 2.5,
            "Strategic Orientation\n\nPro-AI (Aggressive)\nvs.\nAI-Restrictive (Defensive)",
            "#fff9c4")

    # Layer 3: mechanisms
    draw_box(5.0, 1.5, 3.2, 2.5,
            "Mechanisms\n\n• Resource Orchestration (RBV)\n• Sociotechnical Alignment (STS)",
            "#e0e0e0")

    # Layer 4: outcomes
    draw_box(9.5, 4.5, 3.0, 2.5,
            "Business Value (DV1)\n\n• Efficiency\n• Innovation\n• Ambidexterity",
            "#c8e6c9")
    draw_box(9.5, 1.0, 3.0, 2.5,
            "Risk Exposure (DV2)\n\n• Compliance\n• Data Privacy\n• Dependency",
            "#ffcdd2")

    # Connectors
    ax.arrow(3.8, 6.25, 1.1, 0, head_width=0.15, fc='black', length_includes_head=True)
    ax.arrow(6.6, 4.9, 0, -0.8, head_width=0.15, fc='black', length_includes_head=True)
    ax.arrow(8.3, 2.75, 1.1, 2.5, head_width=0.15, fc='black', length_includes_head=True)
    ax.arrow(8.3, 2.75, 1.1, -0.5, head_width=0.15, fc='black', length_includes_head=True)

    save_plot("Figure_2_1_Theoretical_Framework_NoTitle.png")

# ======================== Figure 2.2: J-Curve ========================
def plot_figure_2_2_clean():
    """Render implementation cost curve (J-Curve)"""
    x = np.linspace(0, 10, 100)
    # Pro-AI: initial dip, later rise (nonlinear growth)
    y_pro = 2 + 0.08*x**2.8 - 2.5*np.exp(-0.6*x)
    # AI-Restrictive: linear growth (stable)
    y_res = 2 + 0.45*x

    plt.figure(figsize=(10, 6))
    plt.plot(x, y_pro, label='Pro-AI Organization (High Dynamic Capability)',
            color='#1f77b4', linewidth=3)
    plt.plot(x, y_res, label='AI-Restrictive Organization (Stability Focus)',
            color='#d62728', linestyle='--', linewidth=3)
    plt.axhline(y=2, color='gray', linestyle=':', alpha=0.5)

    # Annotate key points
    plt.annotate('Implementation Dip\n(Productivity Paradox)', xy=(1.5, 1.5),
                xytext=(2.5, 0.5), arrowprops=dict(facecolor='black', shrink=0.05))
    plt.annotate('Flywheel Effect', xy=(9, 9), xytext=(7, 9.5),
                arrowprops=dict(facecolor='#1f77b4', shrink=0.05))

    plt.xlabel('Adoption Maturity (Time)', fontsize=12)
    plt.ylabel('Business Value Realized', fontsize=12)
    plt.legend(fontsize=10)
    plt.grid(True, alpha=0.3)
    save_plot("Figure_2_2_J_Curve_NoTitle.png")

# ======================== Figure 2.3: Risk Distribution ========================
def plot_figure_2_3_clean():
    """Render risk distribution comparison"""
    x = np.linspace(-6, 6, 300)
    # Pro-AI: higher variance (more upside and risk)
    y_pro = norm.pdf(x, 1.5, 2.2)
    # AI-Restrictive: lower variance (controlled risk)
    y_res = norm.pdf(x, 0.5, 0.7)

    plt.figure(figsize=(10, 6))
    plt.plot(x, y_pro, label='Pro-AI (High Variance)', color='#1f77b4', linewidth=2)
    plt.fill_between(x, y_pro, alpha=0.1, color='#1f77b4')
    plt.plot(x, y_res, label='AI-Restrictive (Controlled)', color='#d62728',
            linestyle='--', linewidth=2)
    plt.fill_between(x, y_res, alpha=0.1, color='#d62728')

    # Annotate tail risk
    plt.annotate('Tail Risk Zone\n(Catastrophic Failure)', xy=(-4, 0.01),
                xytext=(-5.5, 0.15), arrowprops=dict(facecolor='red', shrink=0.05),
                fontsize=10, color='#b71c1c')

    plt.xlabel('Business Impact Outcome (Negative = Loss, Positive = Gain)', fontsize=12)
    plt.ylabel('Probability Density', fontsize=12)
    plt.legend(fontsize=10)
    save_plot("Figure_2_3_Risk_Dist_NoTitle.png")

# ======================== Figure 2.4: Governance Matrix ========================
def plot_figure_2_4_clean():
    """Render adoption intensity vs governance centralization matrix"""
    fig, ax = plt.subplots(figsize=(8, 8))
    ax.set_xlim(0, 10)
    ax.set_ylim(0, 10)

    plt.xlabel('Adoption Intensity', fontsize=12, fontweight='bold')
    plt.ylabel('Governance Centralization', fontsize=12, fontweight='bold')

    # Draw midlines
    plt.axvline(x=5, color='gray', linestyle='--')
    plt.axhline(y=5, color='gray', linestyle='--')

    # Top-left: AI-Restrictive (centralized control)
    ax.add_patch(patches.Rectangle((0, 5), 5, 5, color='#ffe0b2', alpha=0.5))
    plt.text(2.5, 7.5, "AI-Restrictive\n(Centralized Control)",
            ha='center', va='center', fontsize=11, fontweight='bold')

    # Top-right: Sustainable AI (balanced)
    ax.add_patch(patches.Rectangle((5, 5), 5, 5, color='#c8e6c9', alpha=0.5))
    plt.text(7.5, 7.5, "Sustainable AI\n(Balanced)",
            ha='center', va='center', fontsize=11, fontweight='bold')

    # Bottom-left: Laggards (no strategy)
    ax.add_patch(patches.Rectangle((0, 0), 5, 5, color='#f5f5f5', alpha=0.5))
    plt.text(2.5, 2.5, "Laggards\n(No Strategy)",
            ha='center', va='center', fontsize=11, fontweight='bold', color='gray')

    # Bottom-right: Unchecked Pro-AI (decentralized)
    ax.add_patch(patches.Rectangle((5, 0), 5, 5, color='#ffcdd2', alpha=0.5))
    plt.text(7.5, 2.5, "Unchecked Pro-AI\n(Decentralized)",
            ha='center', va='center', fontsize=11, fontweight='bold', color='#b71c1c')

    save_plot("Figure_2_4_Matrix_NoTitle.png")

# ======================== Table 2.1: Theoretical Lenses ========================
def plot_table_2_1():
    """Render theoretical lenses table"""
    data = [
        ["Theory", "Core Focus", "Relevance to Pro-AI", "Relevance to AI-Restrictive"],
        ["TOE Framework", "Contextual Drivers", "High Tech Readiness, Agile Culture",
         "High Regulatory Pressure (Env)"],
        ["Resource-Based View", "Value Creation", "AI as a 'Dynamic Capability'",
         "AI as a commodity; Human Capital is the resource"],
        ["Institutional Theory", "Legitimacy", "Mimetic Isomorphism (Copying leaders)",
         "Coercive Isomorphism (Obeying laws)"],
        ["Sociotechnical Systems", "Human-System Fit", "Focus on Automation & Speed",
         "Focus on Trust & Psychological Safety"]
    ]

    fig, ax = plt.subplots(figsize=(12, 4))
    ax.axis('off')

    table = ax.table(cellText=data, loc='center', cellLoc='left',
                    colWidths=[0.2, 0.2, 0.3, 0.3])
    table.auto_set_font_size(False)
    table.set_fontsize(11)
    table.scale(1, 2)

    # Format header row
    for (row, col), cell in table.get_celld().items():
        if row == 0:
            cell.set_text_props(weight='bold', color='white')
            cell.set_facecolor('#404040')
        else:
            cell.set_facecolor('#f9f9f9' if row % 2 else 'white')

    save_plot("Table_2_1_Theoretical_Lenses.png")

# ======================== Table 2.2: Comparative Matrix ========================
def plot_table_2_2():
    """Render Pro-AI vs AI-Restrictive comparison table"""
    data = [
        ["Dimension", "Pro-AI Organization", "AI-Restrictive Organization"],
        ["Primary Goal", "Speed, Innovation, Market Share", "Compliance, Sovereignty, Stability"],
        ["Risk Appetite", "Fail-Fast / Experimental", "Zero-Error / Precautionary Principle"],
        ["Governance Model", "Decentralized (Federated)", "Centralized (Gatekeeper)"],
        ["Data Strategy", "Cloud-Native / API Integration", "Air-Gapped / On-Premise Only"],
        ["Value Driver", "Automation & Generative Capability", "Human Expertise & Trust Premium"]
    ]

    fig, ax = plt.subplots(figsize=(12, 5))
    ax.axis('off')

    table = ax.table(cellText=data, loc='center', cellLoc='left',
                    colWidths=[0.2, 0.4, 0.4])
    table.auto_set_font_size(False)
    table.set_fontsize(11)
    table.scale(1, 2.2)

    for (row, col), cell in table.get_celld().items():
        if row == 0:
            cell.set_text_props(weight='bold', color='white')
            cell.set_facecolor('#0d47a1')
        else:
            cell.set_facecolor('#e3f2fd' if row % 2 else 'white')

    save_plot("Table_2_2_Comparative_Matrix.png")

# ======================== Main ========================
if __name__ == "__main__":
    print("📊 Generating research figures...")
    print("-" * 50)
    plot_figure_2_1_clean()
    plot_figure_2_2_clean()
    plot_figure_2_3_clean()
    plot_figure_2_4_clean()
    plot_table_2_1()
    plot_table_2_2()
    print("-" * 50)
    print("✓ All figures generated successfully!")
Usage notes:
- Save the code above as
generate_research_figures.py - Run
python generate_research_figures.py - All charts will be generated in the
Chapter2_Final_Assets/directory - The generated PNGs can be used directly in papers or presentations
Key Findings and Implications
This framework reveals several core insights:
1. There is no one-size-fits-all optimal strategy
Pro-AI and AI-Restrictive strategies are both rational choices depending on context:
- In highly competitive markets with mature technical foundations and tolerable failure costs, Pro-AI may be the default
- In regulated industries with sensitive data and low tolerance for error, AI-Restrictive is more prudent
2. The key is managing the “dual constraint”
Pro-AI organizations must maintain safety while innovating; AI-Restrictive organizations must seize opportunities while remaining cautious. Both require:
- clear governance frameworks
- strong talent pipelines
- organizational learning capability
- quantitative understanding of risk
3. Early implementation pain is normal
The J-curve shows that initial productivity declines are not failure signals but restructuring pain. The key is to persist through this phase.
4. Tail risk deserves attention
The risk distribution shows that Pro-AI has significant upside but also downside. Substantial investment is required to monitor and prevent “black swan” events.
Further Thoughts
This research provides a framework for enterprise AI strategy, but real-world practice should also consider:
- Dynamic adaptation: enterprises should adjust strategy as market and internal conditions evolve
- Hybrid models: large enterprises may apply different strategies across business units
- Crossing the chasm: shifting from AI-Restrictive to Pro-AI (or vice versa) requires organizational change capability
- Cultural foundations: technology can be purchased, but culture must be built over time
I hope this framework helps your AI strategy thinking.
References
If you want to go deeper, consider reading:
- Weill, P., & Woerner, S. L. (2013). The Gerasimenko Doctrine for IT Strategy
- Teece, D. J. (2018). Business models and dynamic capabilities
- Meyer, J. W., & Rowan, B. (1977). Institutionalized Organizations: Formal Structure as Myth and Ceremony
- Geels, F. W. (2004). From sectoral systems of innovation to socio-technical systems
Last updated: January 17, 2026