1
2
3
4
5
6
7
8
9
10
11
12
13
14
15
16
17
18
19
20
21
22
23
24
25
26
27
28
29
30
31
32
33
34
35
36
37
38
39
40
41
42
43
44
45
46
47
48
49
50
51
52
53
54
55
56
57
58
59
60
61
62
63
64
65
66
67
68
69
70
71
72
73
74
75
76
77
78
79
80
81
82
83
84
85
86
87
88
89
90
91
92
93
94
95
96
97
98
99
100
101
102
103
104
105
106
107
108
109
110
111
112
113
114
115
116
117
118
119
120
121
122
123
124
125
126
127
128
129
130
131
132
133
134
135
136
137
138
139
140
141
142
143
144
145
146
147
148
149
150
151
152
153
154
155
156
157
158
159
160
161
162
163
164
165
166
167
168
169
170
171
172
173
174
175
176
177
178
179
180
181
182
183
184
185
186
187
188
189
190
191
192
193
194
195
196
197
198
199
200
201
202
203
204
205
206
207
208
209
210
211
212
213
214
215
216
217
218
219
220
221
222
223
224
225
226
227
228
229
230
231
232
233
234
235
236
237
| import matplotlib.pyplot as plt
import numpy as np
import matplotlib.patches as patches
import seaborn as sns
from scipy.stats import norm
import pandas as pd
import os
plt.style.use('default')
sns.set_style("whitegrid")
plt.rcParams['font.family'] = 'serif'
plt.rcParams['font.serif'] = ['Times New Roman'] + plt.rcParams['font.serif']
plt.rcParams['axes.unicode_minus'] = False
save_dir = 'Chapter2_Final_Assets'
if not os.path.exists(save_dir):
os.makedirs(save_dir)
def save_plot(filename):
"""保存图表到指定目录"""
path = os.path.join(save_dir, filename)
plt.savefig(path, dpi=300, bbox_inches='tight')
plt.close()
print(f"✓ Saved: {path}")
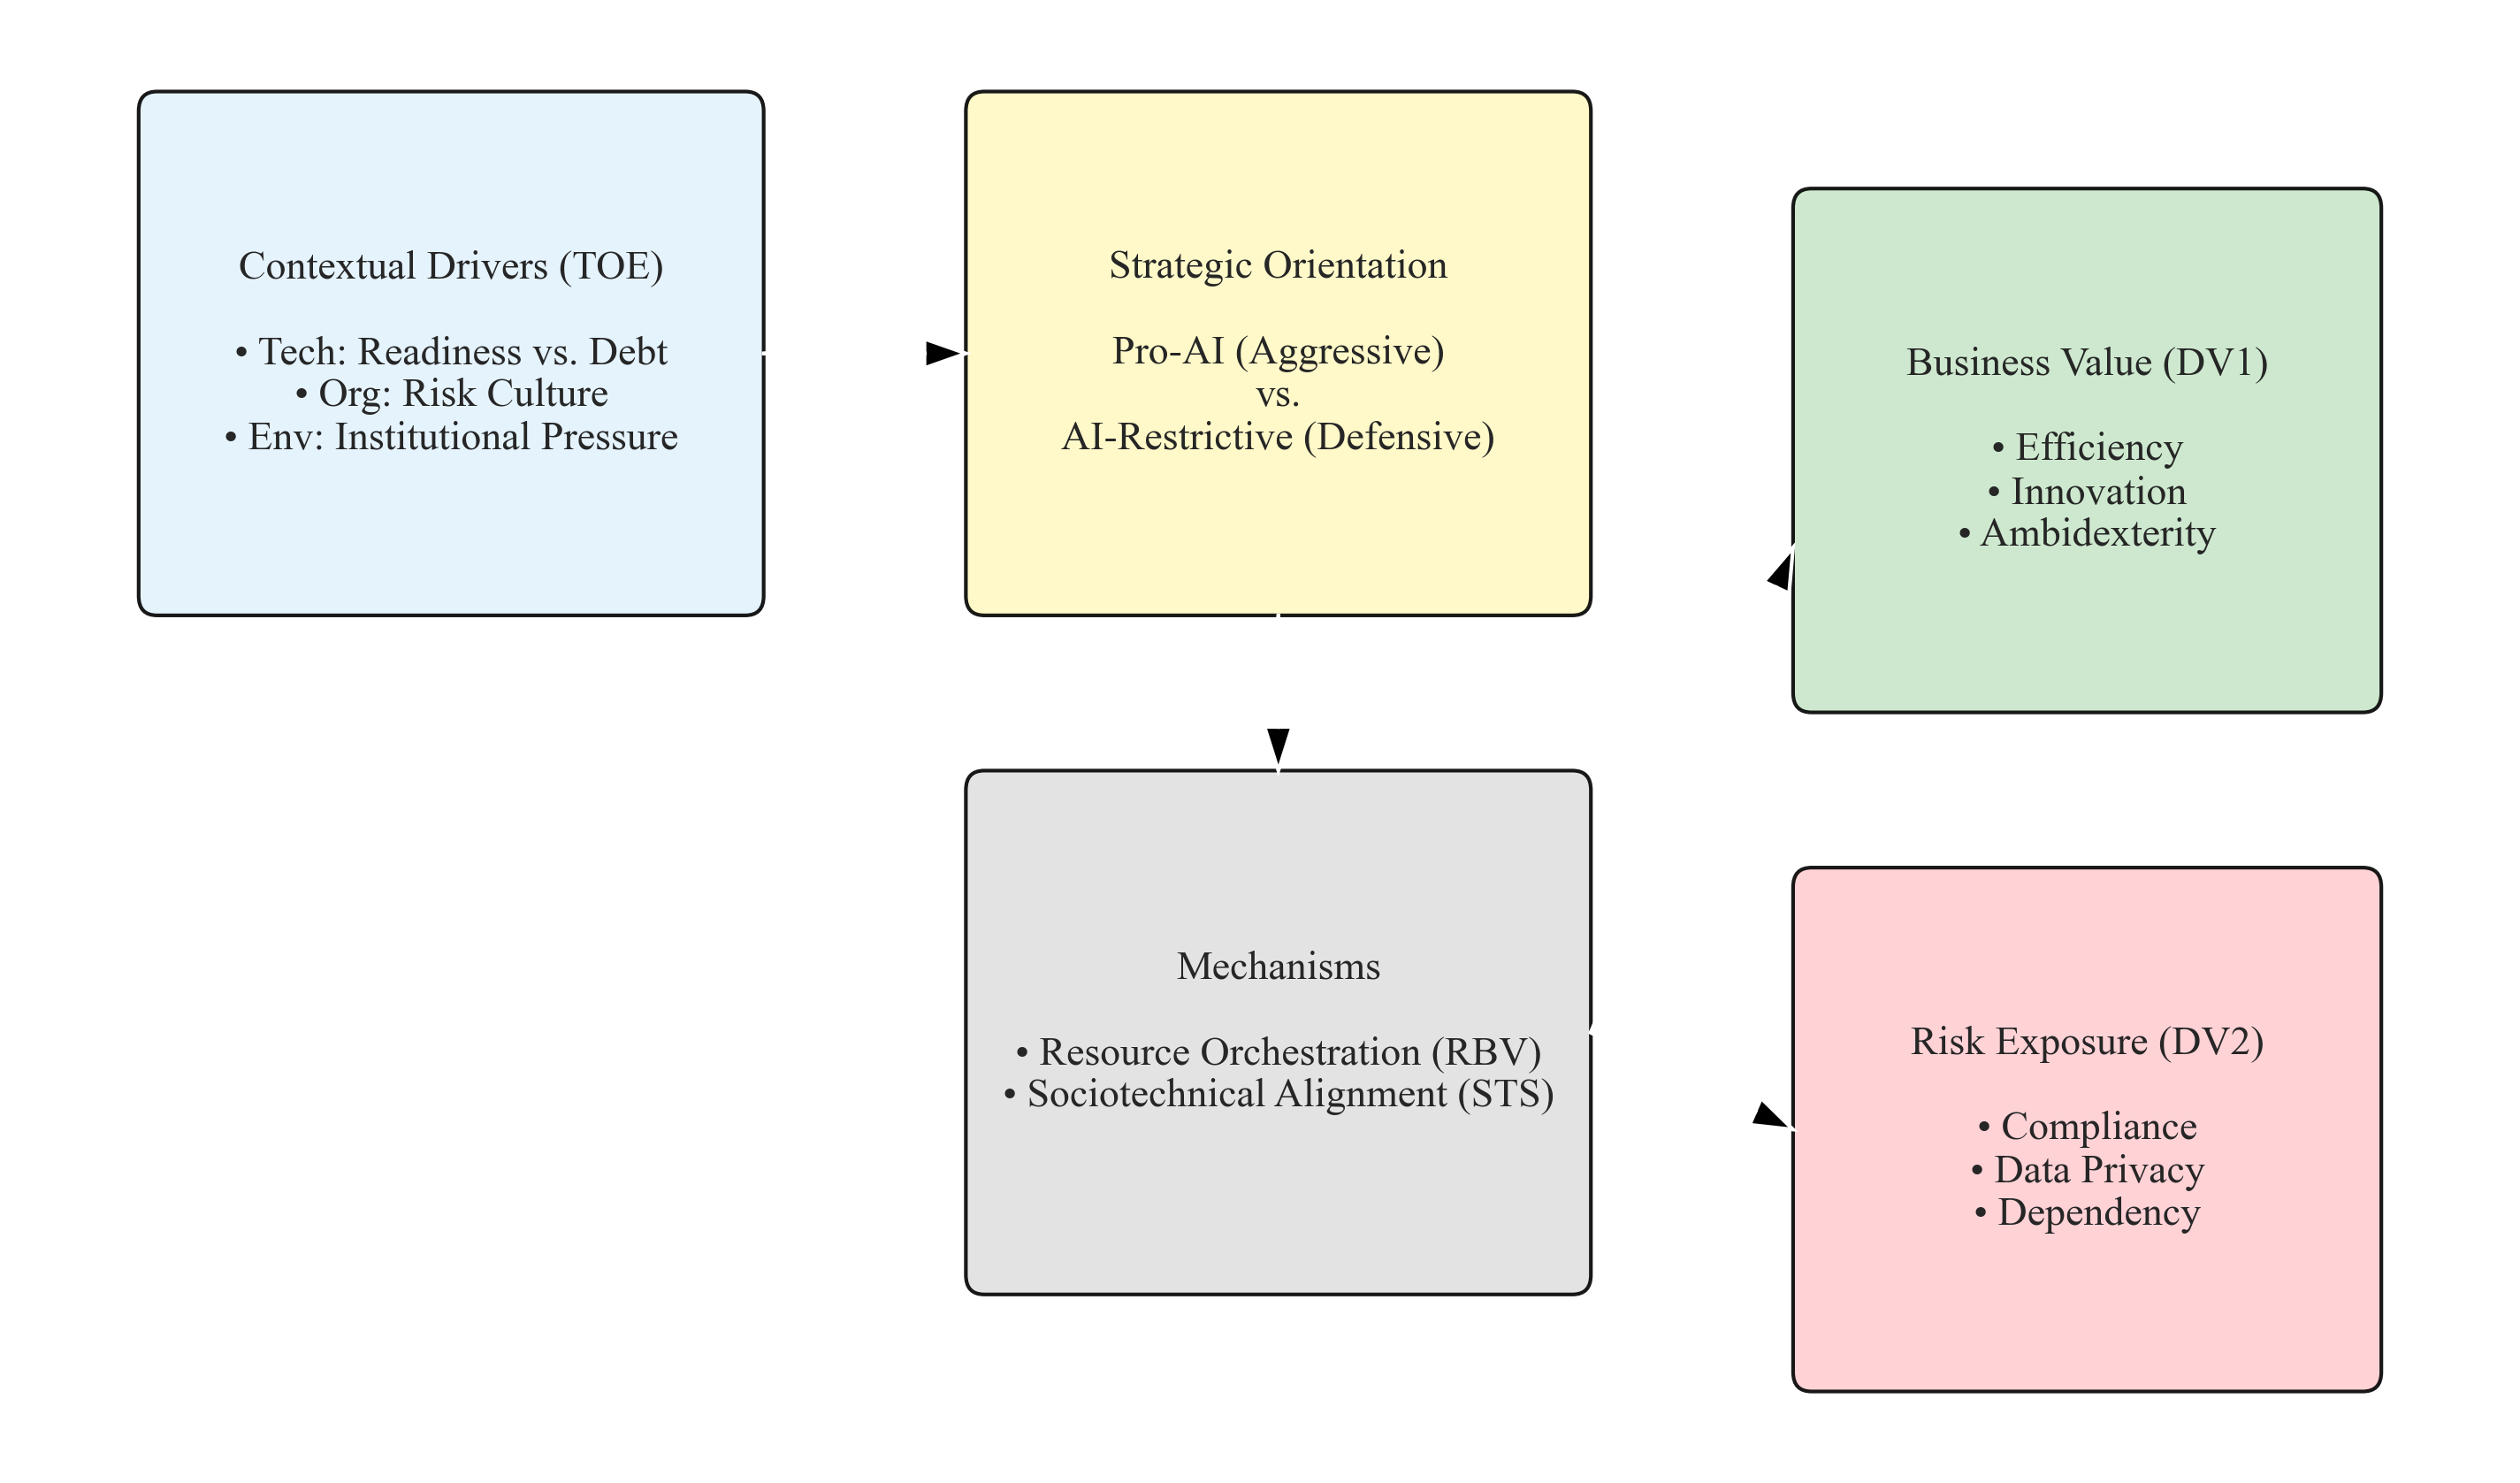
def plot_figure_2_1_clean():
"""绘制整合理论框架"""
fig, ax = plt.subplots(figsize=(12, 7))
ax.axis('off')
def draw_box(x, y, w, h, text, color):
"""辅助函数:绘制圆角矩形框"""
rect = patches.FancyBboxPatch((x, y), w, h, boxstyle="round,pad=0.1",
fc=color, ec="black", alpha=0.9)
ax.add_patch(rect)
ax.text(x + w/2, y + h/2, text, ha='center', va='center',
fontsize=11, wrap=True)
draw_box(0.5, 5, 3.2, 2.5,
"Contextual Drivers (TOE)\n\n• Tech: Readiness vs. Debt\n• Org: Risk Culture\n• Env: Institutional Pressure",
"#e3f2fd")
draw_box(5.0, 5, 3.2, 2.5,
"Strategic Orientation\n\nPro-AI (Aggressive)\nvs.\nAI-Restrictive (Defensive)",
"#fff9c4")
draw_box(5.0, 1.5, 3.2, 2.5,
"Mechanisms\n\n• Resource Orchestration (RBV)\n• Sociotechnical Alignment (STS)",
"#e0e0e0")
draw_box(9.5, 4.5, 3.0, 2.5,
"Business Value (DV1)\n\n• Efficiency\n• Innovation\n• Ambidexterity",
"#c8e6c9")
draw_box(9.5, 1.0, 3.0, 2.5,
"Risk Exposure (DV2)\n\n• Compliance\n• Data Privacy\n• Dependency",
"#ffcdd2")
ax.arrow(3.8, 6.25, 1.1, 0, head_width=0.15, fc='black', length_includes_head=True)
ax.arrow(6.6, 4.9, 0, -0.8, head_width=0.15, fc='black', length_includes_head=True)
ax.arrow(8.3, 2.75, 1.1, 2.5, head_width=0.15, fc='black', length_includes_head=True)
ax.arrow(8.3, 2.75, 1.1, -0.5, head_width=0.15, fc='black', length_includes_head=True)
save_plot("Figure_2_1_Theoretical_Framework_NoTitle.png")
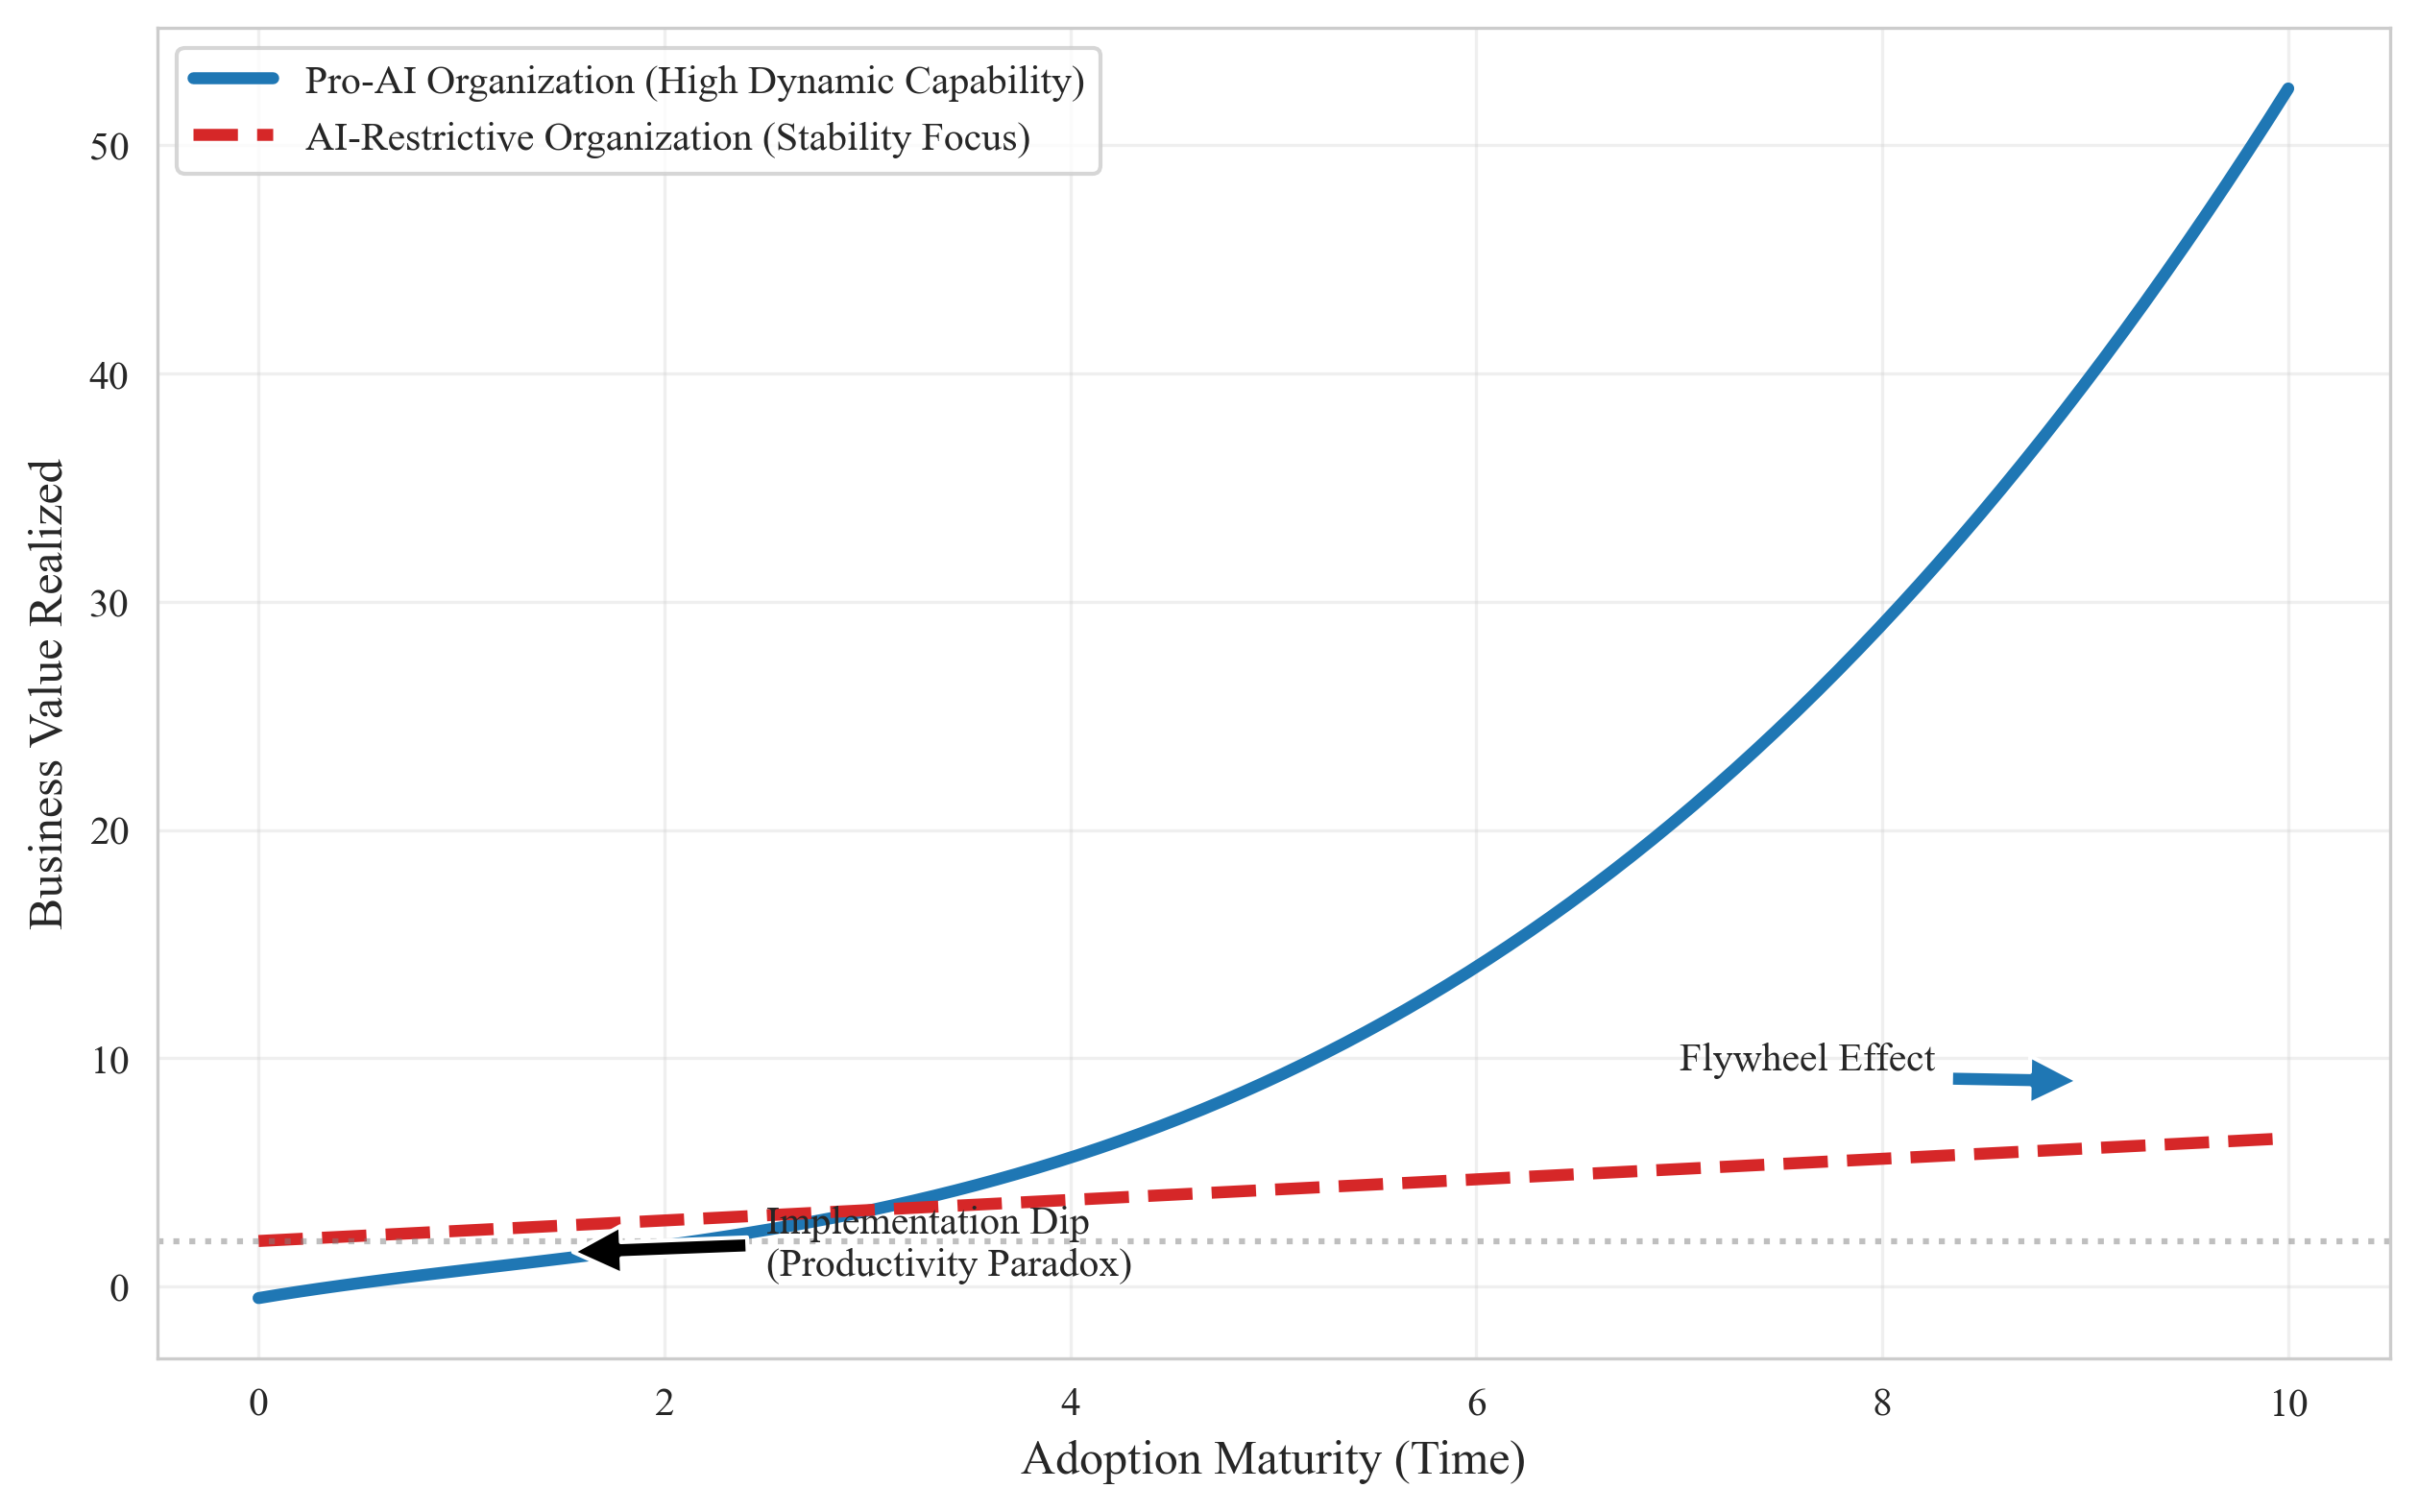
def plot_figure_2_2_clean():
"""绘制实施成本曲线(J-Curve)"""
x = np.linspace(0, 10, 100)
y_pro = 2 + 0.08*x**2.8 - 2.5*np.exp(-0.6*x)
y_res = 2 + 0.45*x
plt.figure(figsize=(10, 6))
plt.plot(x, y_pro, label='Pro-AI Organization (High Dynamic Capability)',
color='#1f77b4', linewidth=3)
plt.plot(x, y_res, label='AI-Restrictive Organization (Stability Focus)',
color='#d62728', linestyle='--', linewidth=3)
plt.axhline(y=2, color='gray', linestyle=':', alpha=0.5)
plt.annotate('Implementation Dip\n(Productivity Paradox)', xy=(1.5, 1.5),
xytext=(2.5, 0.5), arrowprops=dict(facecolor='black', shrink=0.05))
plt.annotate('Flywheel Effect', xy=(9, 9), xytext=(7, 9.5),
arrowprops=dict(facecolor='#1f77b4', shrink=0.05))
plt.xlabel('Adoption Maturity (Time)', fontsize=12)
plt.ylabel('Business Value Realized', fontsize=12)
plt.legend(fontsize=10)
plt.grid(True, alpha=0.3)
save_plot("Figure_2_2_J_Curve_NoTitle.png")
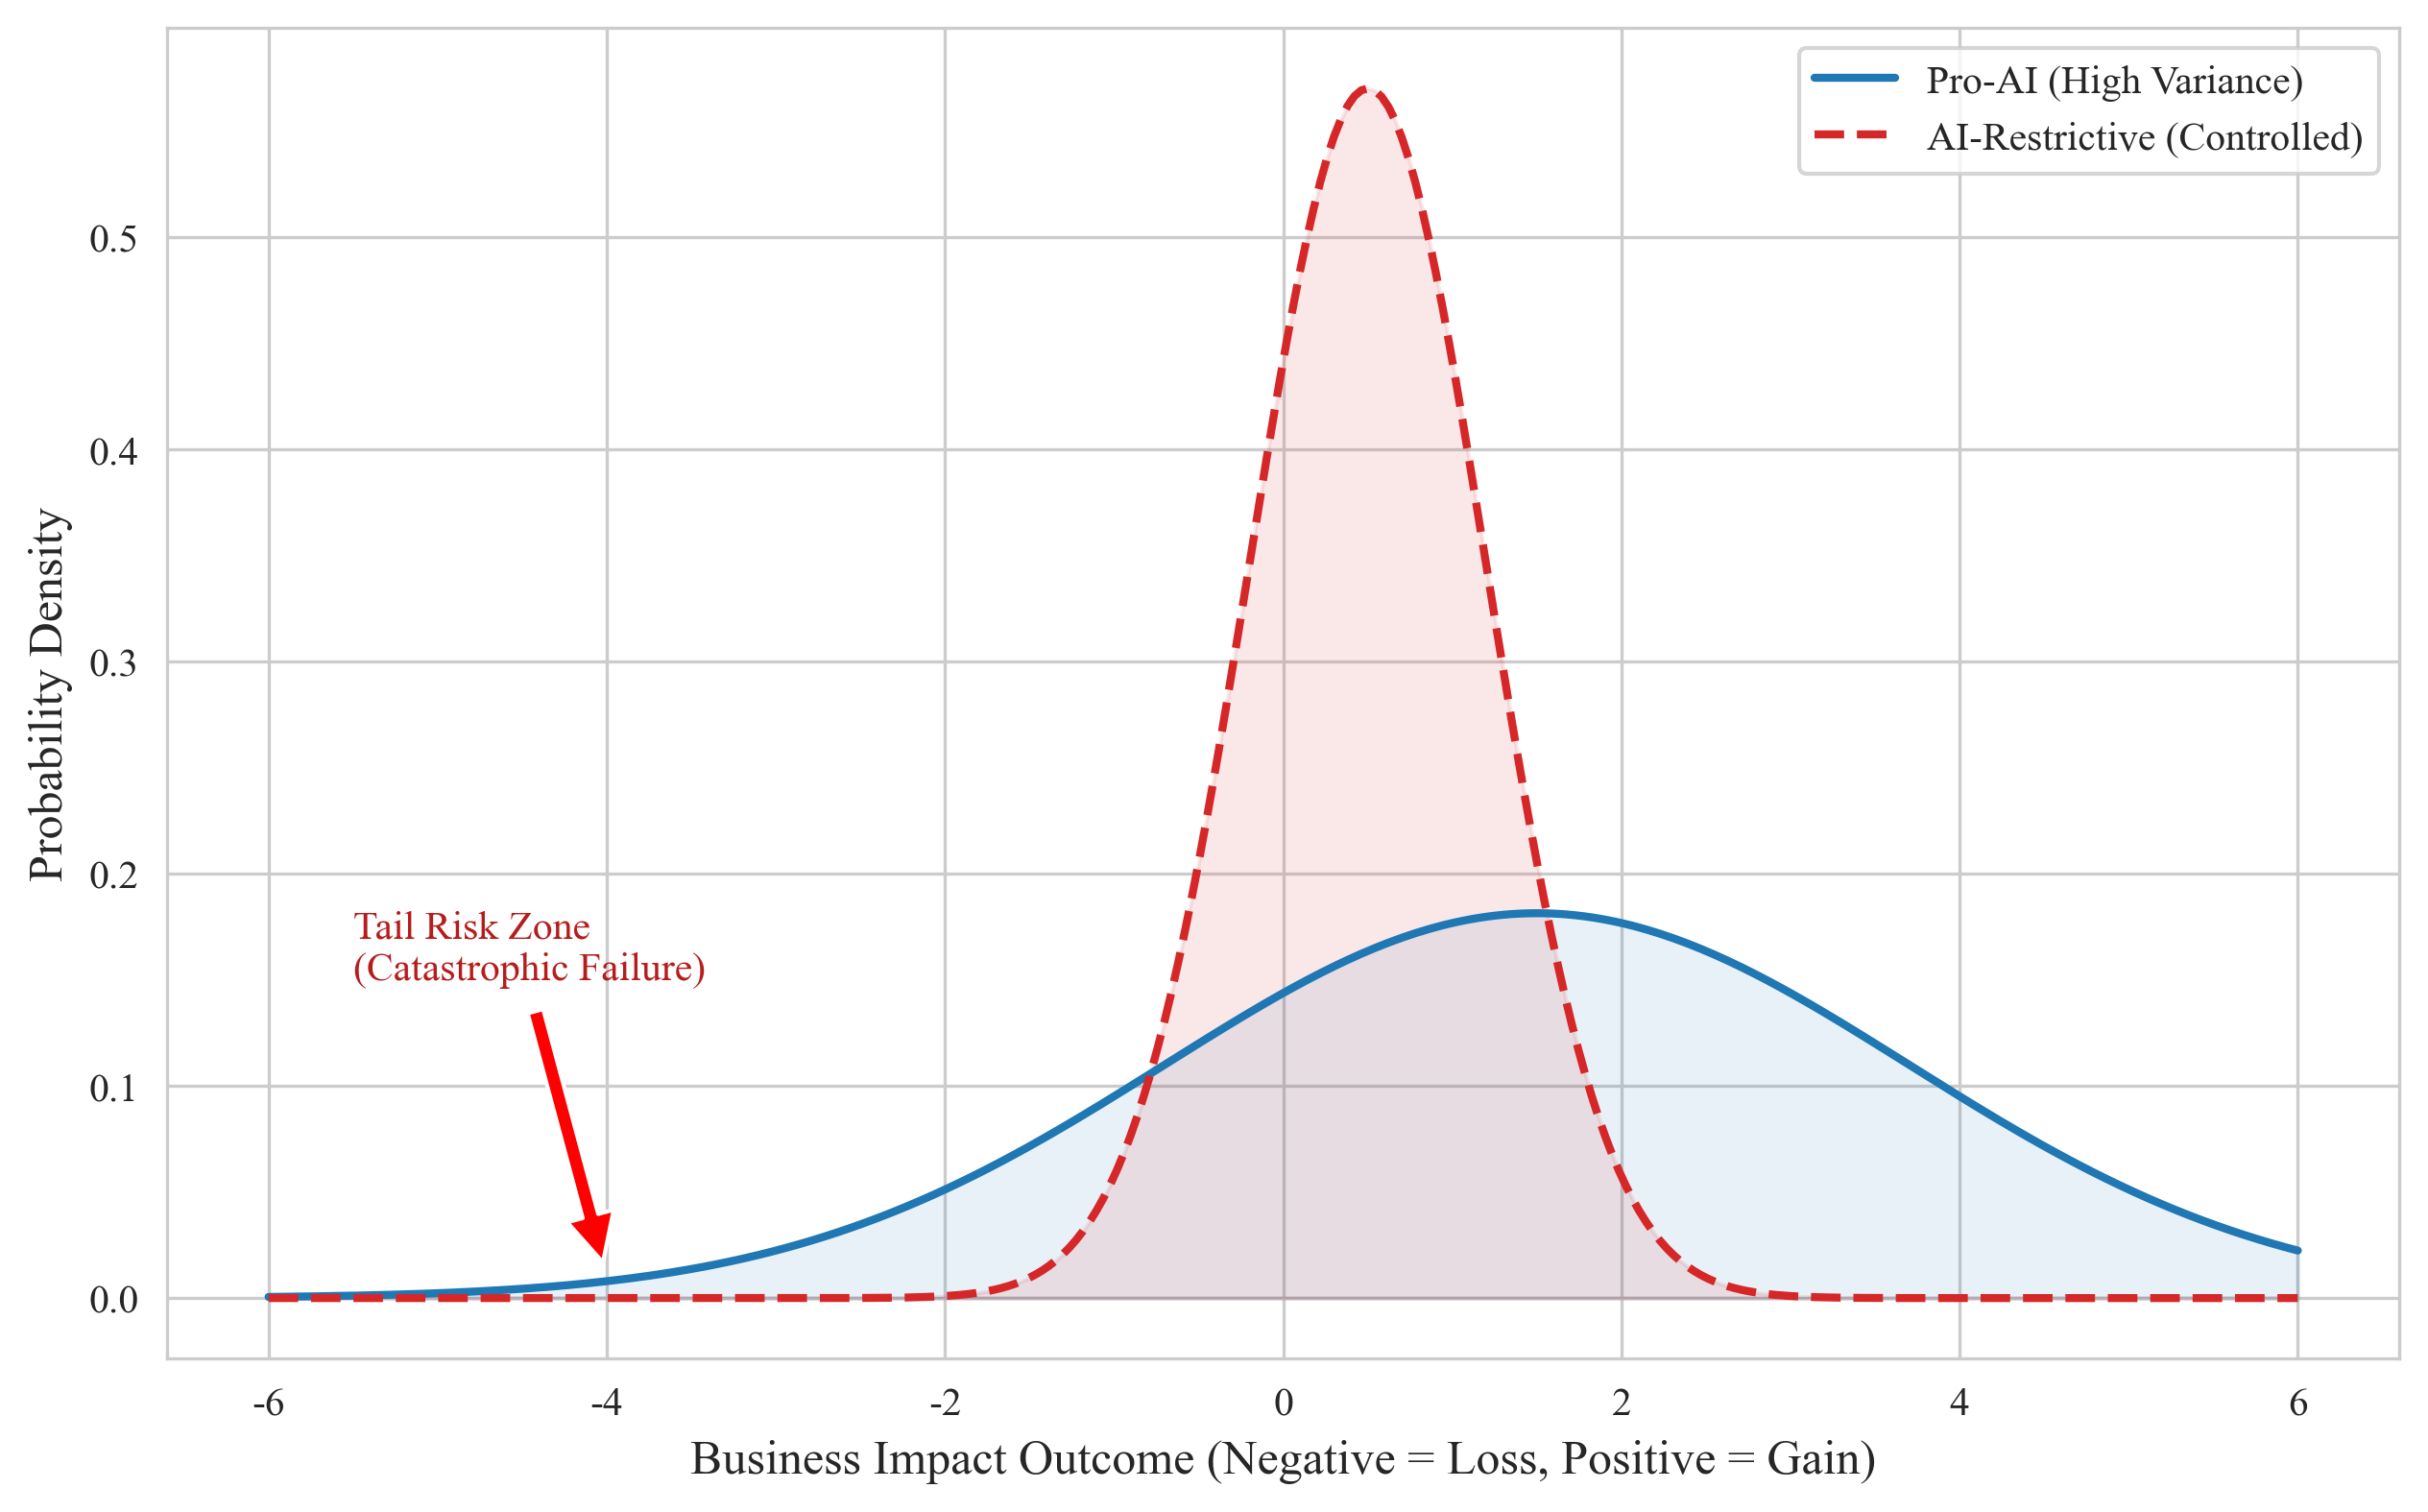
def plot_figure_2_3_clean():
"""绘制两种战略的风险分布对比"""
x = np.linspace(-6, 6, 300)
y_pro = norm.pdf(x, 1.5, 2.2)
y_res = norm.pdf(x, 0.5, 0.7)
plt.figure(figsize=(10, 6))
plt.plot(x, y_pro, label='Pro-AI (High Variance)', color='#1f77b4', linewidth=2)
plt.fill_between(x, y_pro, alpha=0.1, color='#1f77b4')
plt.plot(x, y_res, label='AI-Restrictive (Controlled)', color='#d62728',
linestyle='--', linewidth=2)
plt.fill_between(x, y_res, alpha=0.1, color='#d62728')
plt.annotate('Tail Risk Zone\n(Catastrophic Failure)', xy=(-4, 0.01),
xytext=(-5.5, 0.15), arrowprops=dict(facecolor='red', shrink=0.05),
fontsize=10, color='#b71c1c')
plt.xlabel('Business Impact Outcome (Negative = Loss, Positive = Gain)', fontsize=12)
plt.ylabel('Probability Density', fontsize=12)
plt.legend(fontsize=10)
save_plot("Figure_2_3_Risk_Dist_NoTitle.png")
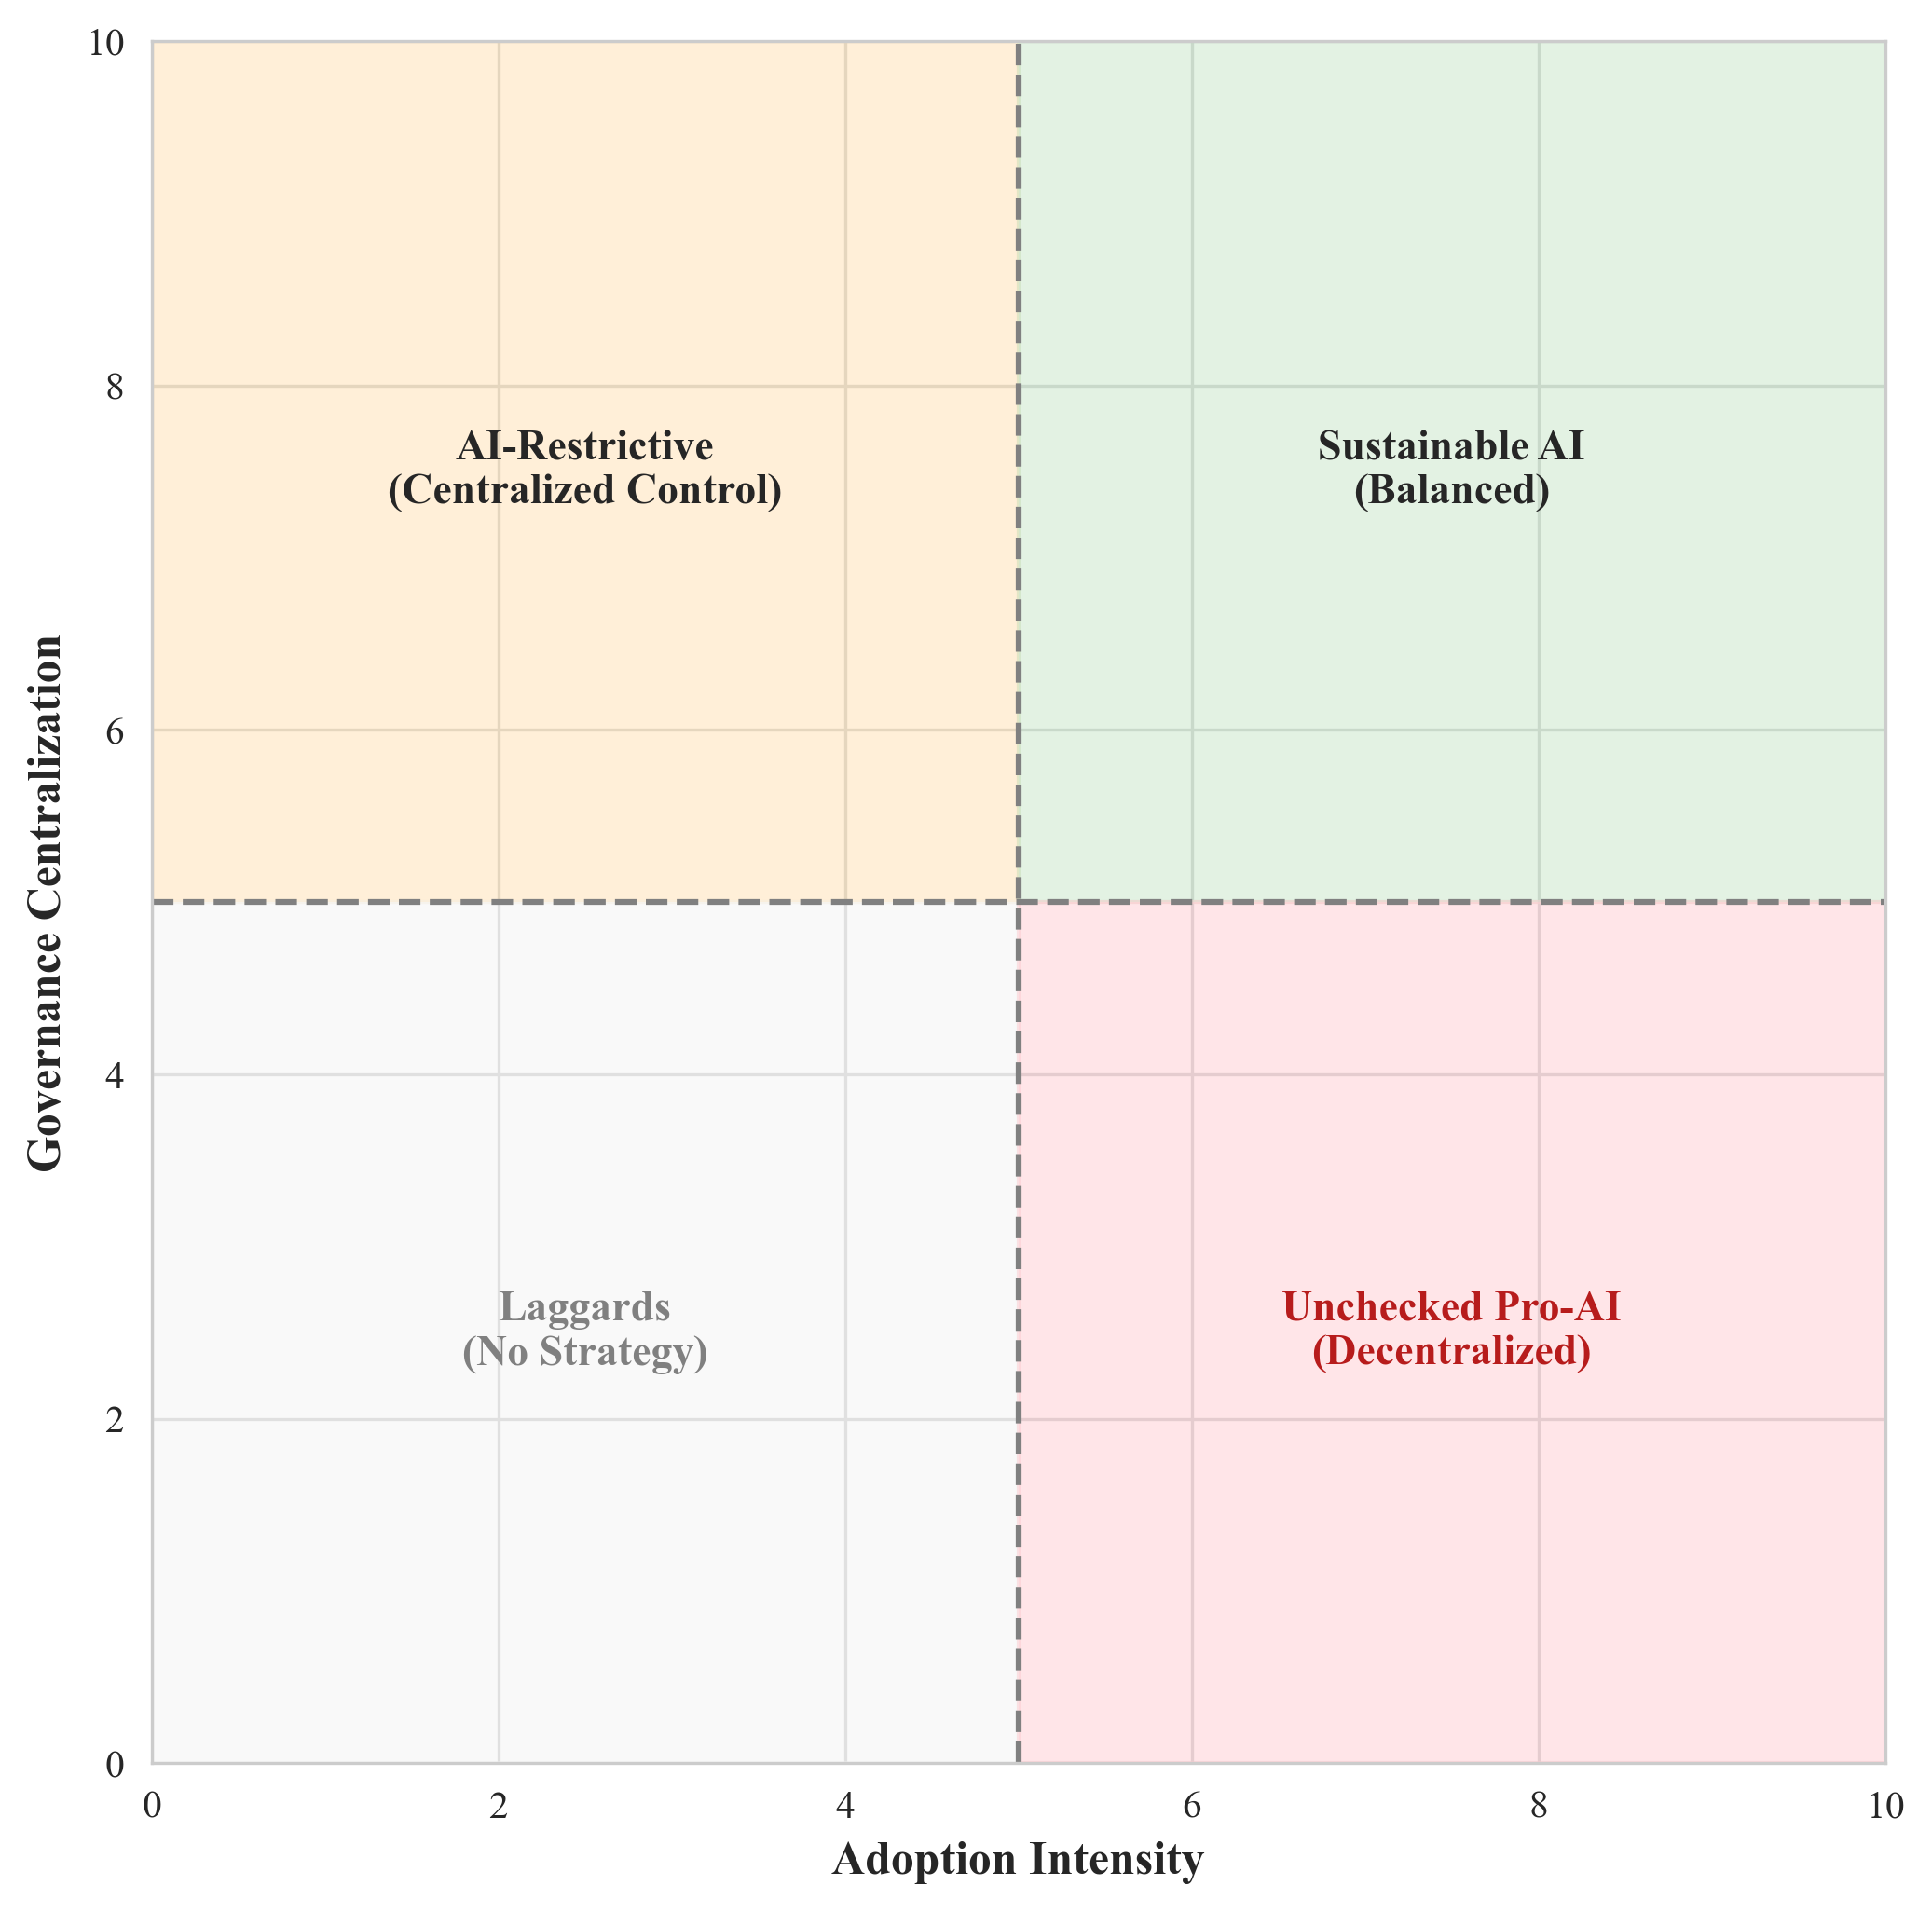
def plot_figure_2_4_clean():
"""绘制采纳强度-治理集中度矩阵"""
fig, ax = plt.subplots(figsize=(8, 8))
ax.set_xlim(0, 10)
ax.set_ylim(0, 10)
plt.xlabel('Adoption Intensity', fontsize=12, fontweight='bold')
plt.ylabel('Governance Centralization', fontsize=12, fontweight='bold')
plt.axvline(x=5, color='gray', linestyle='--')
plt.axhline(y=5, color='gray', linestyle='--')
ax.add_patch(patches.Rectangle((0, 5), 5, 5, color='#ffe0b2', alpha=0.5))
plt.text(2.5, 7.5, "AI-Restrictive\n(Centralized Control)",
ha='center', va='center', fontsize=11, fontweight='bold')
ax.add_patch(patches.Rectangle((5, 5), 5, 5, color='#c8e6c9', alpha=0.5))
plt.text(7.5, 7.5, "Sustainable AI\n(Balanced)",
ha='center', va='center', fontsize=11, fontweight='bold')
ax.add_patch(patches.Rectangle((0, 0), 5, 5, color='#f5f5f5', alpha=0.5))
plt.text(2.5, 2.5, "Laggards\n(No Strategy)",
ha='center', va='center', fontsize=11, fontweight='bold', color='gray')
ax.add_patch(patches.Rectangle((5, 0), 5, 5, color='#ffcdd2', alpha=0.5))
plt.text(7.5, 2.5, "Unchecked Pro-AI\n(Decentralized)",
ha='center', va='center', fontsize=11, fontweight='bold', color='#b71c1c')
save_plot("Figure_2_4_Matrix_NoTitle.png")
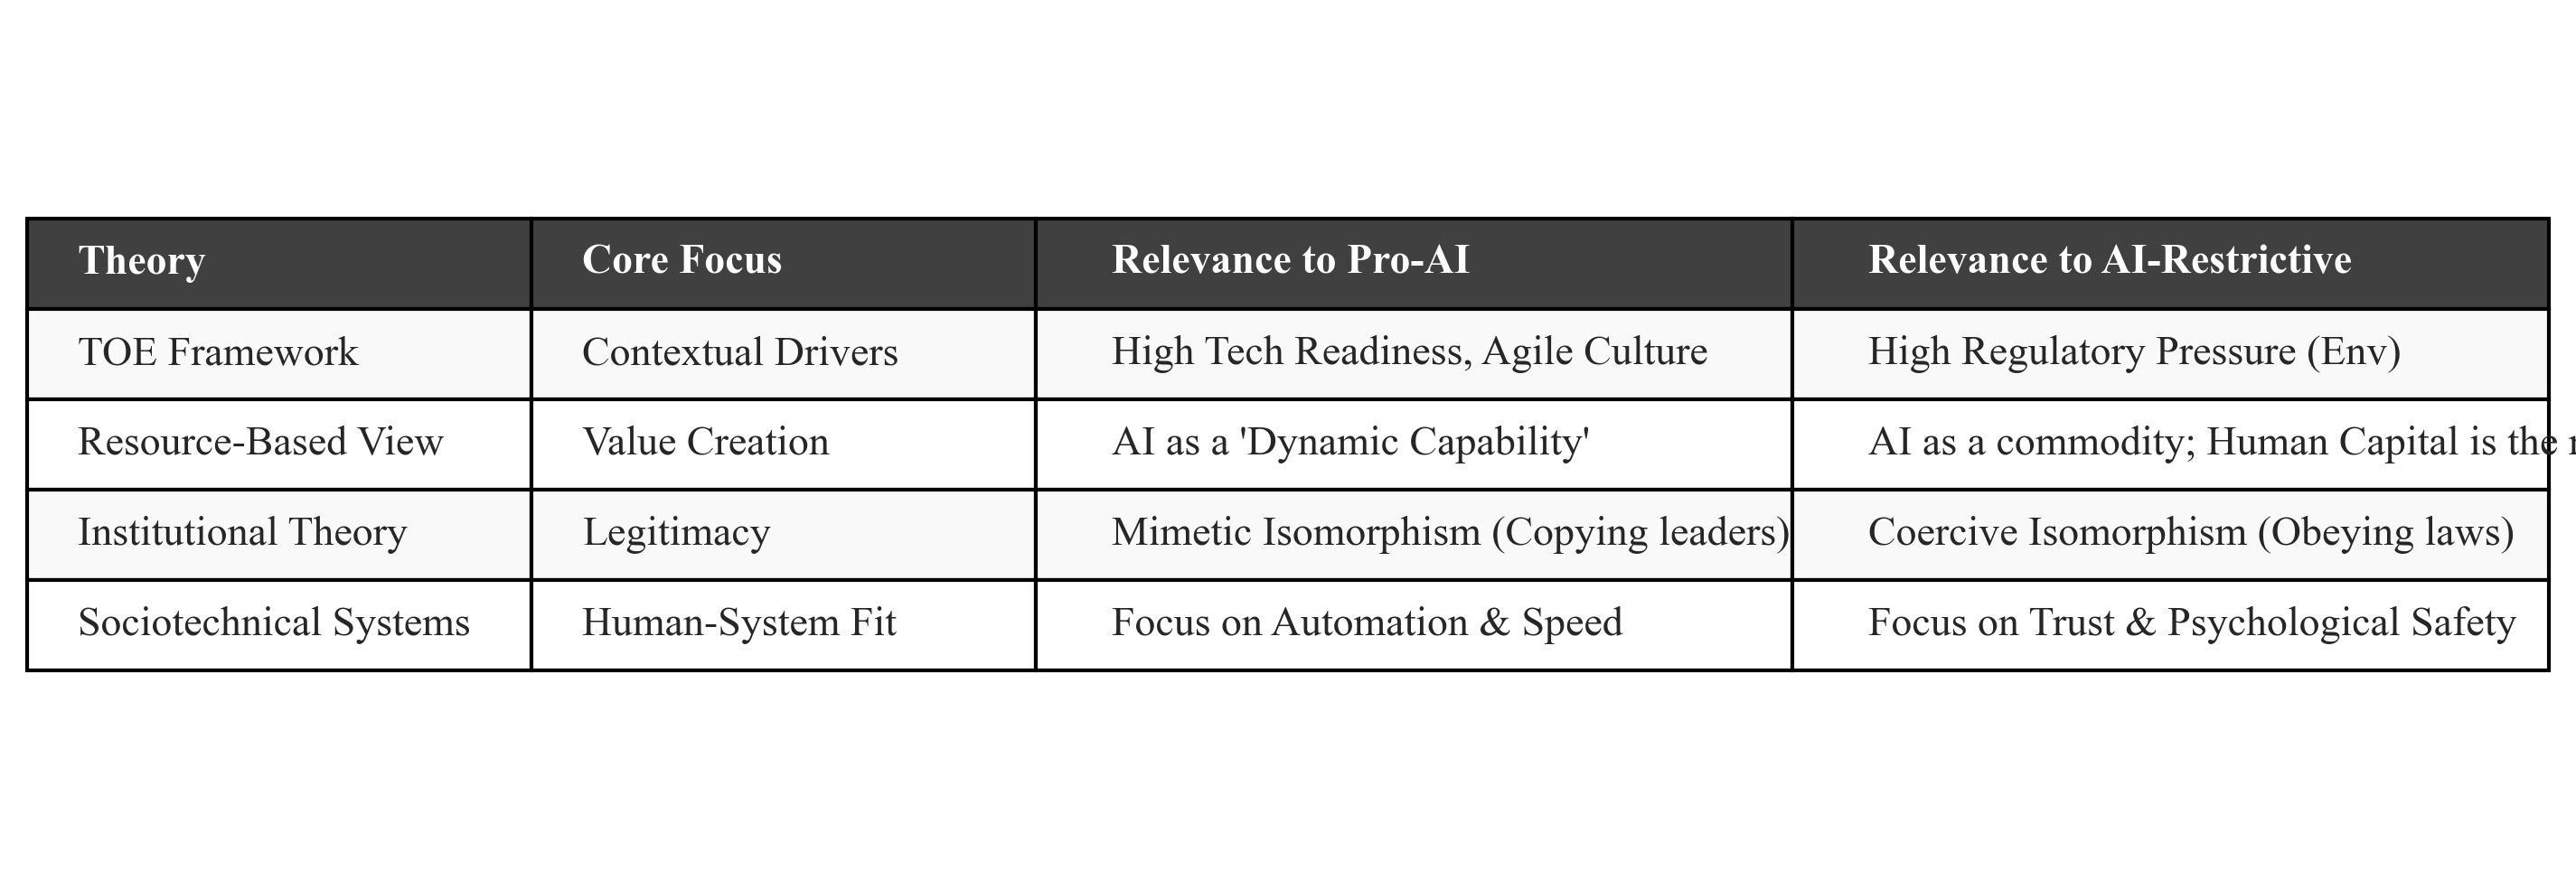
def plot_table_2_1():
"""绘制理论框架对比表"""
data = [
["Theory", "Core Focus", "Relevance to Pro-AI", "Relevance to AI-Restrictive"],
["TOE Framework", "Contextual Drivers", "High Tech Readiness, Agile Culture",
"High Regulatory Pressure (Env)"],
["Resource-Based View", "Value Creation", "AI as a 'Dynamic Capability'",
"AI as a commodity; Human Capital is the resource"],
["Institutional Theory", "Legitimacy", "Mimetic Isomorphism (Copying leaders)",
"Coercive Isomorphism (Obeying laws)"],
["Sociotechnical Systems", "Human-System Fit", "Focus on Automation & Speed",
"Focus on Trust & Psychological Safety"]
]
fig, ax = plt.subplots(figsize=(12, 4))
ax.axis('off')
table = ax.table(cellText=data, loc='center', cellLoc='left',
colWidths=[0.2, 0.2, 0.3, 0.3])
table.auto_set_font_size(False)
table.set_fontsize(11)
table.scale(1, 2)
for (row, col), cell in table.get_celld().items():
if row == 0:
cell.set_text_props(weight='bold', color='white')
cell.set_facecolor('#404040')
else:
cell.set_facecolor('#f9f9f9' if row % 2 else 'white')
save_plot("Table_2_1_Theoretical_Lenses.png")
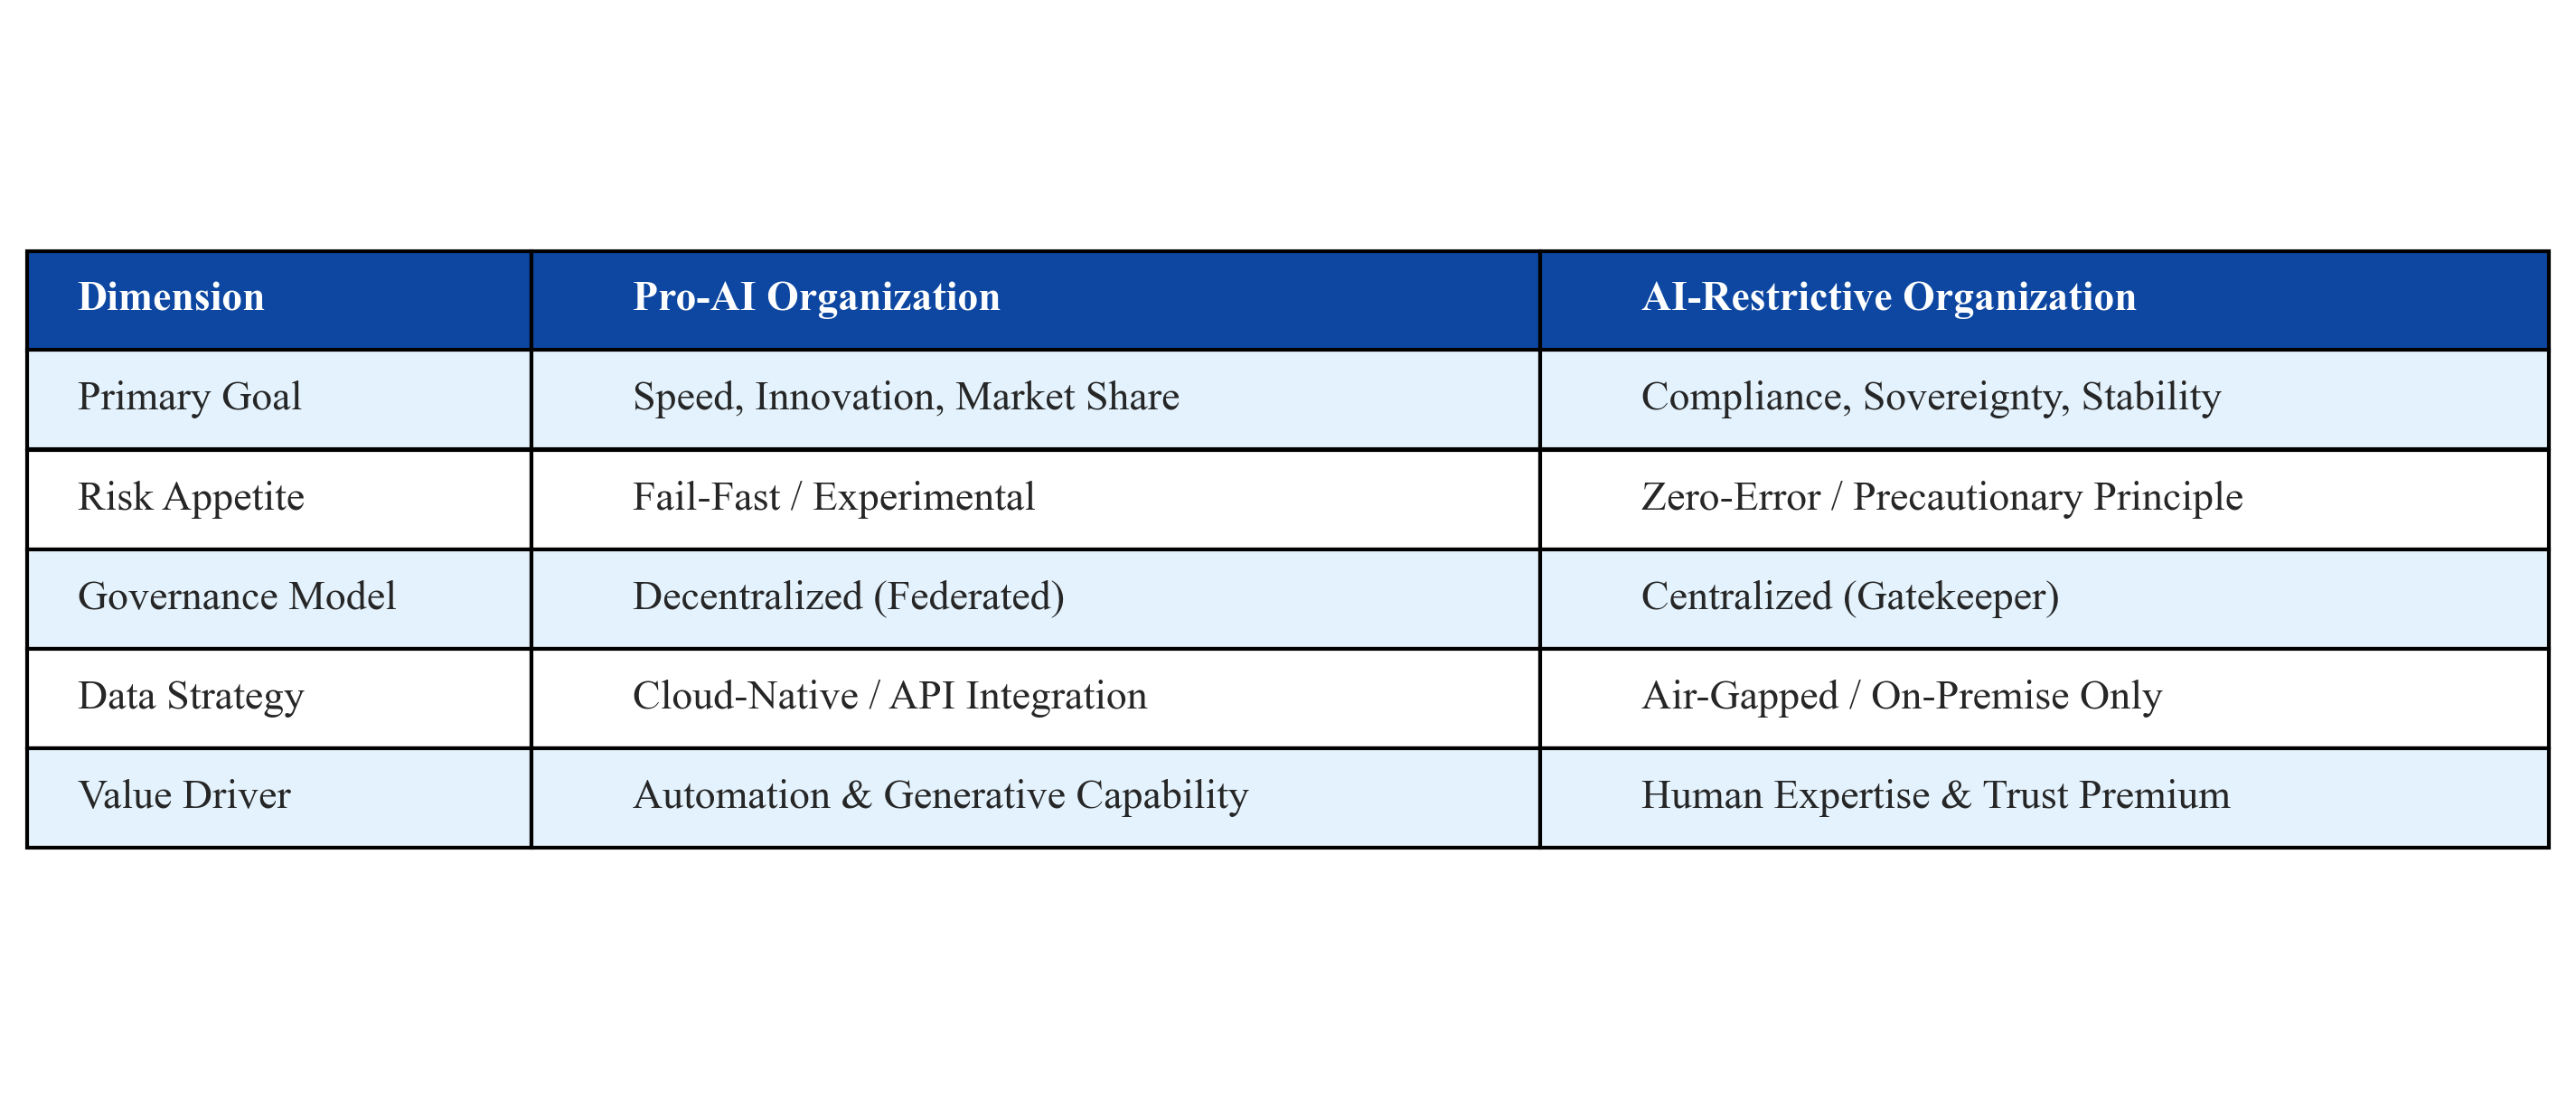
def plot_table_2_2():
"""绘制Pro-AI vs AI-Restrictive对比表"""
data = [
["Dimension", "Pro-AI Organization", "AI-Restrictive Organization"],
["Primary Goal", "Speed, Innovation, Market Share", "Compliance, Sovereignty, Stability"],
["Risk Appetite", "Fail-Fast / Experimental", "Zero-Error / Precautionary Principle"],
["Governance Model", "Decentralized (Federated)", "Centralized (Gatekeeper)"],
["Data Strategy", "Cloud-Native / API Integration", "Air-Gapped / On-Premise Only"],
["Value Driver", "Automation & Generative Capability", "Human Expertise & Trust Premium"]
]
fig, ax = plt.subplots(figsize=(12, 5))
ax.axis('off')
table = ax.table(cellText=data, loc='center', cellLoc='left',
colWidths=[0.2, 0.4, 0.4])
table.auto_set_font_size(False)
table.set_fontsize(11)
table.scale(1, 2.2)
for (row, col), cell in table.get_celld().items():
if row == 0:
cell.set_text_props(weight='bold', color='white')
cell.set_facecolor('#0d47a1')
else:
cell.set_facecolor('#e3f2fd' if row % 2 else 'white')
save_plot("Table_2_2_Comparative_Matrix.png")
if __name__ == "__main__":
print("📊 开始生成研究图表...")
print("-" * 50)
plot_figure_2_1_clean()
plot_figure_2_2_clean()
plot_figure_2_3_clean()
plot_figure_2_4_clean()
plot_table_2_1()
plot_table_2_2()
print("-" * 50)
print("✓ 所有图表已成功生成!")
|